Dear Readers,
Before we get into this week’s edition, a big thank you to everyone who came up to us at the Bitcoin Conference in Las Vegas. We’re humbled by the encouragement and conversations we had with so many TBL readers, viewers, and listeners. It was an honor to meet you, share ideas, and sign copies of Bitcoin Age in person. We're truly grateful.
Feeling as inspired as we do after the conference, we chose this Weekly as the inauguration of a new trading strategy that we discovered recently in the TBL Liquidity lab. That is, starting this week, we will track the performance of two different strategies in both bitcoin and the S&P 500 using a mock $10,000 portfolio:
Buy-and-Hold (B&H): In the investment policy world, one’s fixed long-term position in a specific asset is often referred to as a strategic asset allocation; this will represent our benchmark, assuming most bitcoin and retail holders subscribe to this personal policy.
Trough-to-Peak (TTP): In the investment policy world, deviating from one’s fixed, long-term asset allocation to capitalize on certain market inefficiencies is known as a tactical asset allocation. With this strategy, the TBL Research team will be looking at TBL Liquidity timing signals that point to ‘buys’ or ‘sells.’
Note that we will do the same for an all-SPY ETF portfolio for those of you who also want to see stock market results.
You asked for more actionable research, and we are responding. A disclaimer from this post is that we are using a mock portfolio (i.e., paper trading) for this experiment. This is merely an experiment for research purposes; this is not intended to be used as financial advice.
In this article, we will:
Examine the fundamentals behind the discovery of the TTP strategy
Backtest and compare the performance of the TTP strategy against the B&H strategy
Determine whether our mock portfolio is buying or not as of today using this TTP strategy
So, without further ado, let’s dive into TBL Weekly #143.
In the first 100 days of the new administration, pro-bitcoin rhetoric has turned into policy.
A new executive order established a national strategic bitcoin reserve and directed the Treasury and Commerce departments to explore growing the reserve within a budget-neutral framework.
Unchained and the Bitcoin Policy Institute are hosting a live panel with Congressman Nick Begich, BPI Executive Director Matthew Pines, and Unchained’s Joe Burnett—and releasing a full report that explains what’s happening and why it matters.
In this session, you’ll learn:
Why the Strategic Bitcoin Reserve Executive Order is a policy milestone
What new legislative and enforcement shifts mean for bitcoin’s future
How to position yourself before the window closes
Register for the June 3 event and read the full 100 Days Brief
❌ DON’T WRITE YOUR SEED ON PAPER 📝
It’s estimated that ~30% of Bitcoin is lost forever. Poor seed phrase security is a big reason why. This is why we use Stamp Seed, a DIY kit that enables you to hammer your seed words into a durable plate of titanium using professional stamping tools.
Heat-resistant to 3,000ºF, rust-proof, crush-proof, and time-proof
Compact and easy to hide
No loose parts, such as screws or letter tiles
Take 15% off with code: TBL.
Our videos are on major podcast platforms—take us with you on the go!
Apple Podcasts Spotify Fountain
Keep up with The Bitcoin Layer by following our social media!
YouTube X LinkedIn Instagram TikTok
Weekly Analysis
Trough-to-Peak Strategy Fundamentals
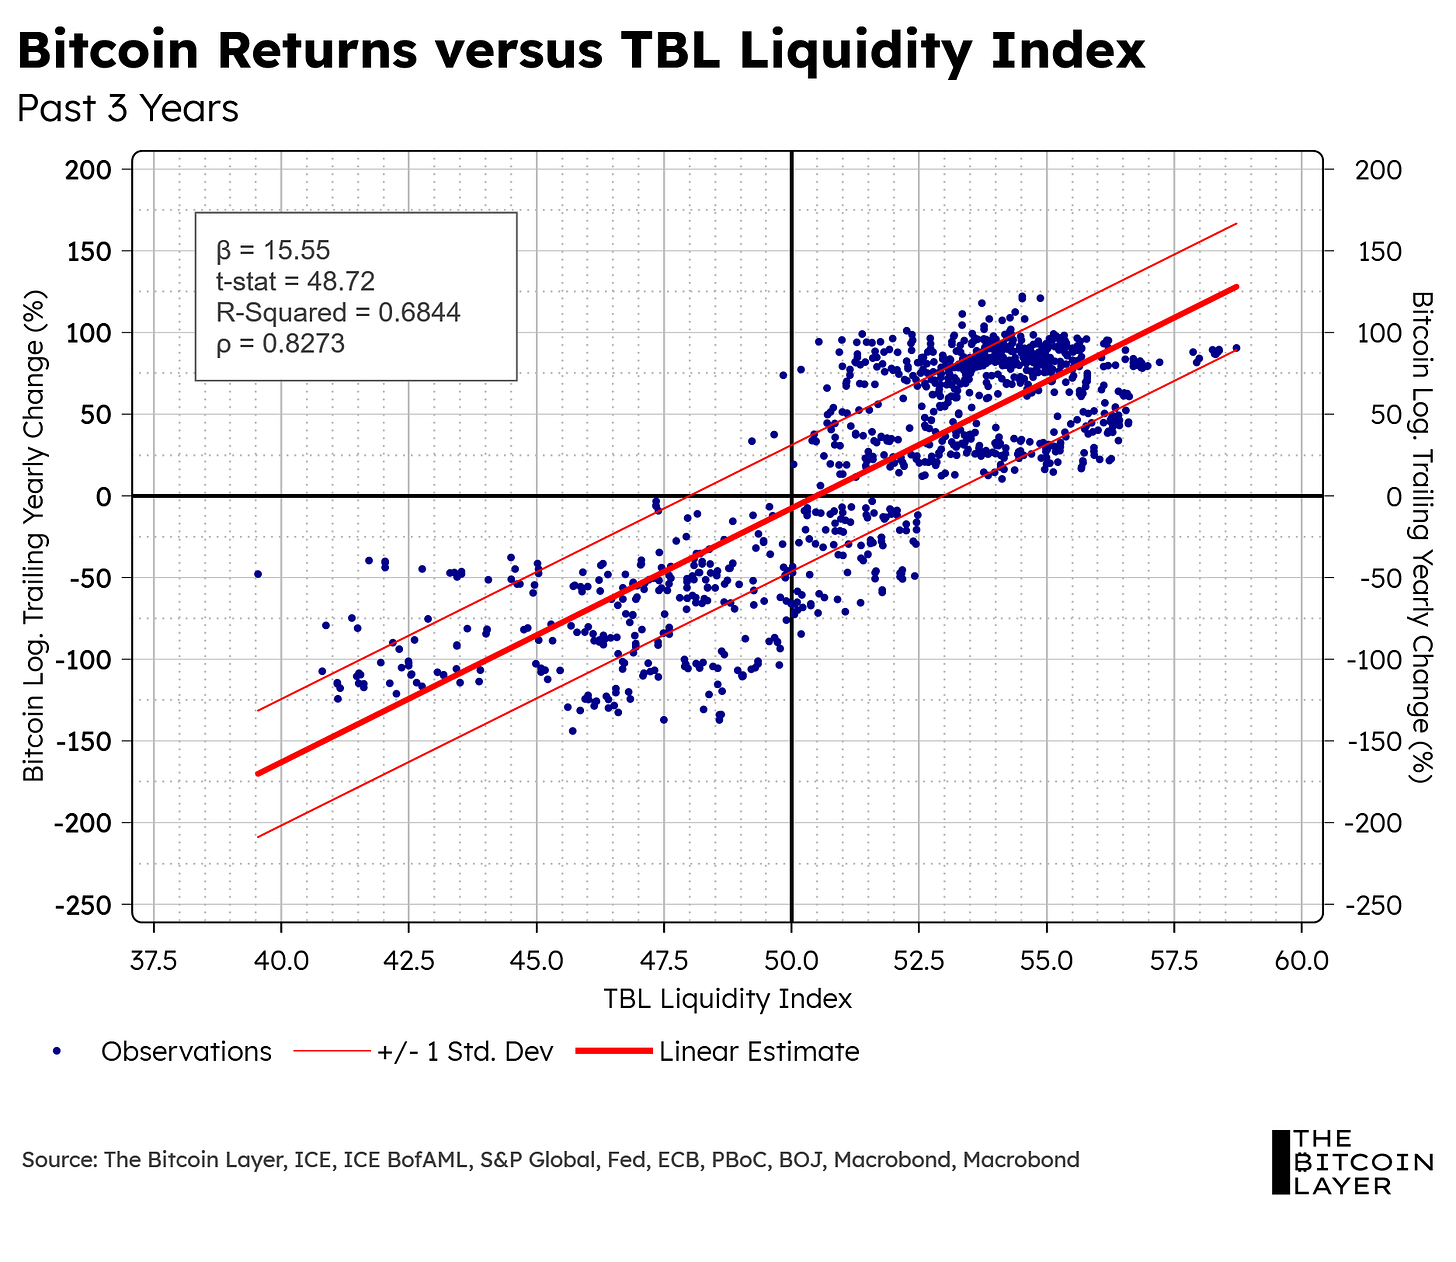
As many of you know by now, TBL Liquidity has been a project we’ve been developing for the past year, but one that the TBL Research team has been theoretically building for most of our careers. After countless hours in the TBL Liquidity lab, our model has managed to achieve an extremely high correlation with both bitcoin and the stock market. To better visualize this close relationship, below is a 3D regression where you can see that the higher the TBL Liquidity, the higher the returns in both bitcoin and stocks (here for the interactive chart in case you want to play with it yourself):
Note that this regression used daily observations from the past three years. When using this timeline, we find an extremely high correlation coefficient between risk assets and TBL Liquidity. Specifically, an 83% correlation with both of them:
While having a high correlation is great and all, how can one derive signal from our model? Well, in our most recent Mean Median Mode report, we explored this very question through some observational analysis (but without actually running the numbers).
To keep it simple, we have identified a TBL Liquidity Quarterly Cycle. When we plot the 30-day nominal change of our TBL Liquidity index, we find what appears to be a trigonometric function (a wave) with some decent consistencies:
Looking at the distances between all peaks, here’s what we found:
The average distance between each TBL Liquidity peak is approximately 84 days (or 2.74 months) with a -/+ 1 standard deviation range of 60 to 108 days.
Backtesting the TTP Strategy
Let us now actually see the results of buying bitcoin or stocks at a TBL Liquidity trough and selling at a peak…


