Bitcoin Is Grinding Sideways, but the On-Chain Data Says a Lower Low Is Unlikely
Derivatives tell you where the market might go. On-chain tells you how people behaved because of it.


Crabbing along
Bitcoin is crabbing along. It finds itself most likely in the ‘Time Capitulation’ area of the bear market. While price is just -1.6% lower than last week’s letter, it still showed some interesting price action. We’ll go over what I thought was interesting and we’ll dive into the on-chain category of the Trend Composition to dissect what is going on there.
Last week price was trading around $65,500 while I was writing and was murmurating about the bitcoin market entering the ‘Disbelief’ phase of the psychological market cycle. One of the most promising moves was the 25 Delta skew going from -7% towards -2%, which I thought could be a signal we’ve seen in 2022. The other reason was the bullish PCR for the 31-JUL-2026 expiry, a position the investors involved probably wanted to maintain and defend. TBL Liquidity flipped to ‘SELL’ which was reason for caution, but based on the relative bullish signs from the option data, my take was that bitcoin could make the jump towards $73,000 to battle it out with the 200-day MA.
So yeah, that didn’t happen. Price got rejected around the $66,500. In ‘Johan’s Corner’ in our TBL Community, I flagged some short-term bearish price action. It was the opposite of what we saw two weeks ago, when we got a daily bullish engulfing candle. Please come hang out in our community and ask questions and get some in-between updates on our thoughts.
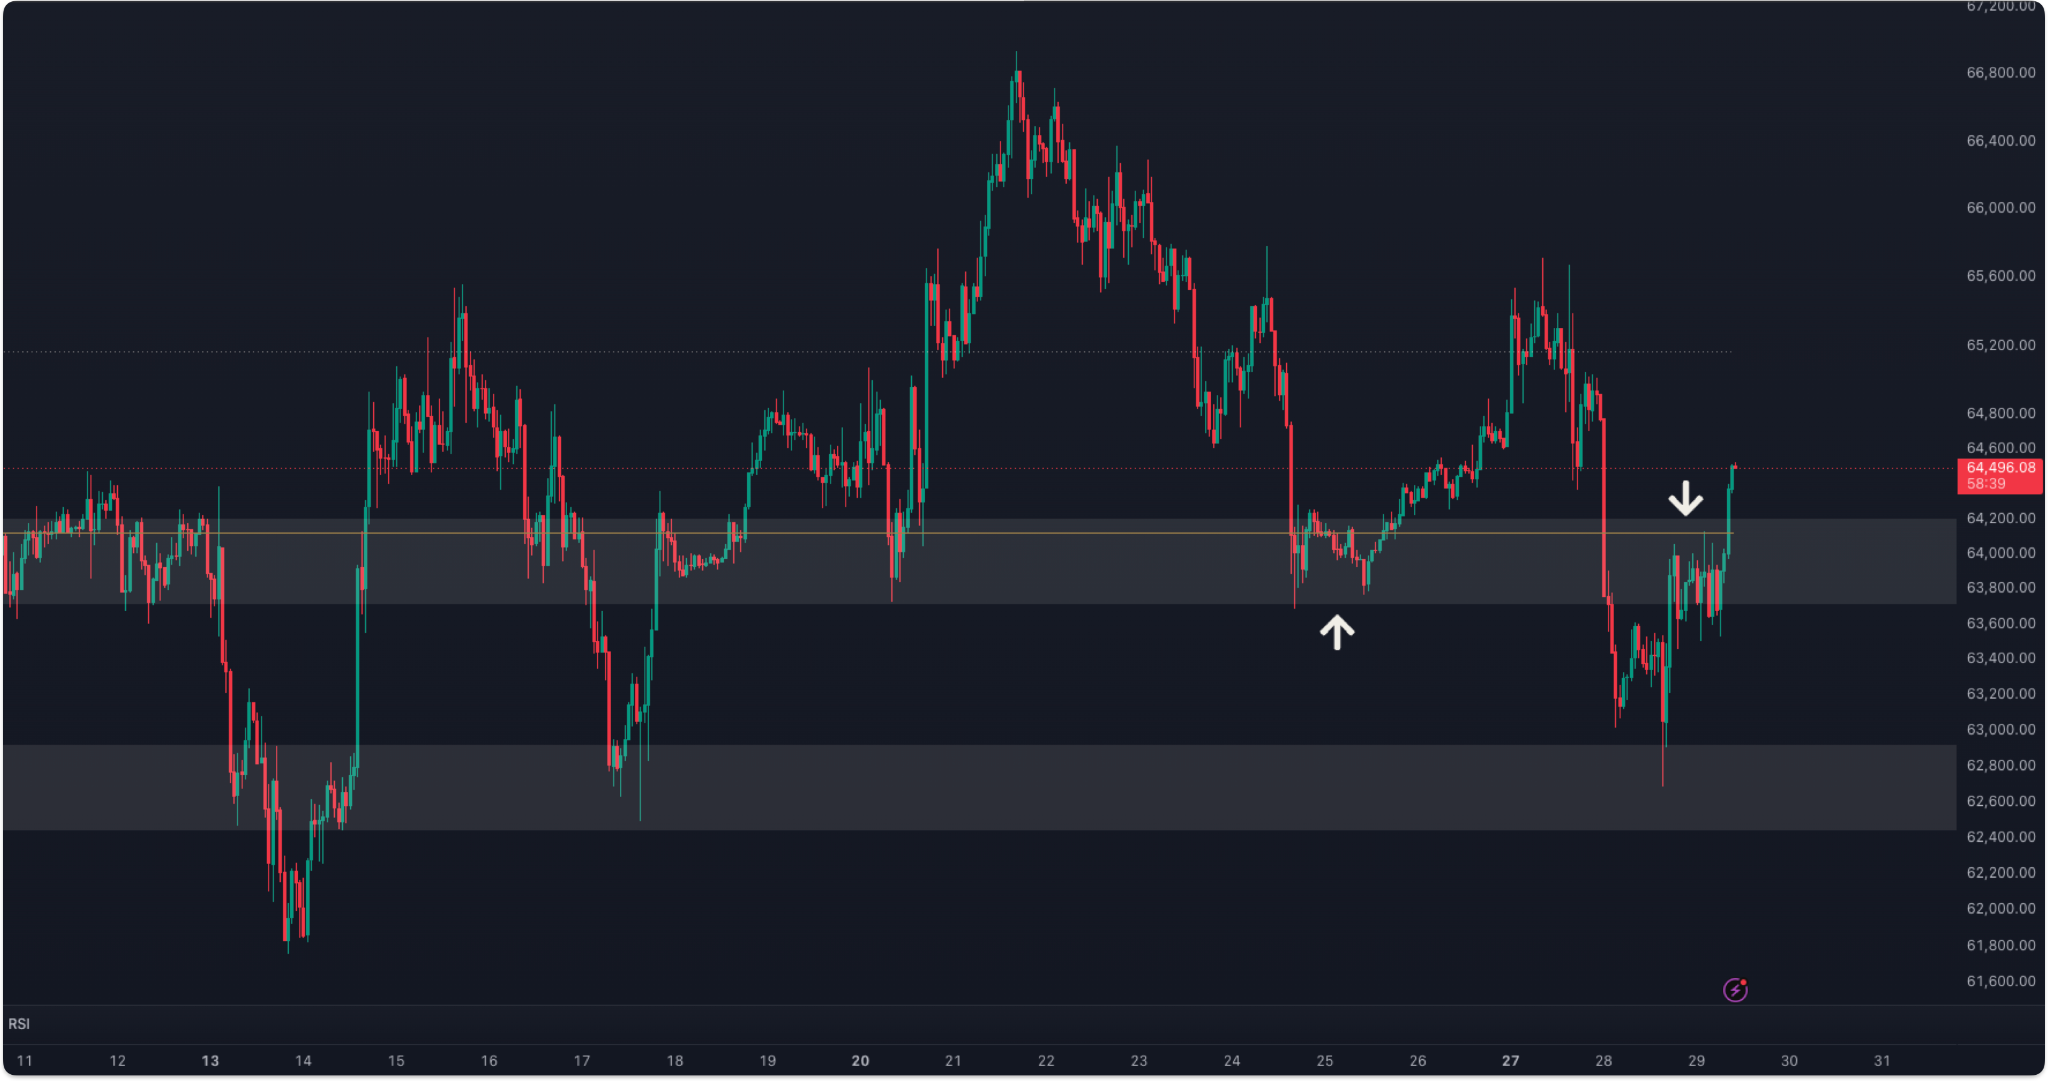
In my post I wrote that I wanted to see the $64,200 area hold and if that wasn’t the case, it would invalidate my thesis of going forward to $73,000.
That was when the price went down to the number 1 on the chart. It survived the weekend and even picked up some momentum on Monday. The level that I flagged was the Point-of-Control (the bronze line) of the area since the sell-off towards the lows. **The Point-of-Control is the level where the most volume traded, but most of the time also where the largest High Volume Node is.** So a cluster of volume. It could act as support or become resistance once price gets below it.
Then the same bearish pattern occurred. Price went back up towards the spot it sold off from in the first place, but rather than gaining the area, it got rejected. No bueno. As a response we got a daily bearish engulfing candle.
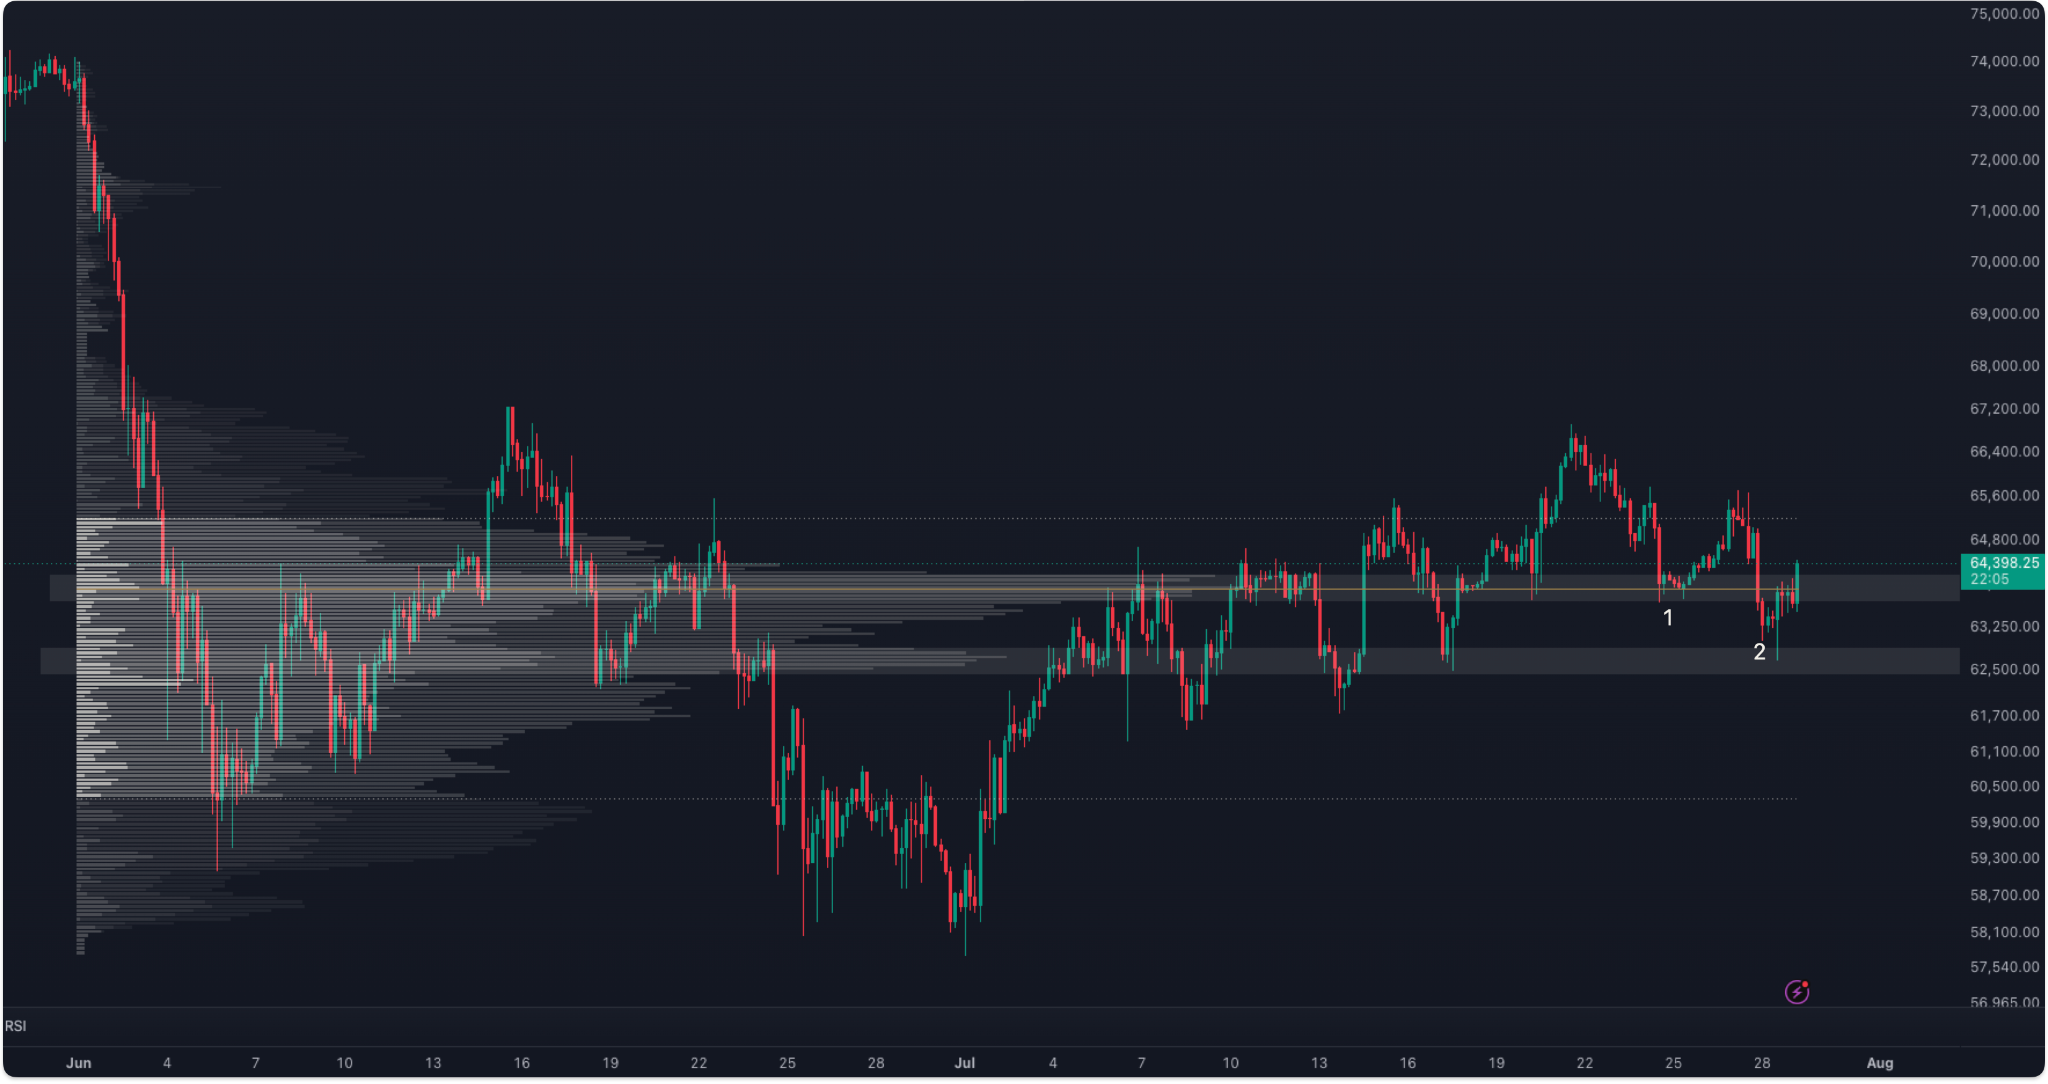
Price fell below the PoC of the most recent range that it’s forming and made lower lows on the low timeframe. For me, this is reason to become more cautious and prepare for a possible sweep of the lows again.
For 14 hours straight, price got rejected at the PoC. Again, this wasn’t looking very good and continuation to the downside was in the cards. But then just like that, it got back above the PoC and started to consolidate over the $64,400, probably getting prepared for some weird shenanigans during and after the FOMC decision today.