

Bitcoin, Stocks, and Rates: How Do They Relate?
Correlations are a compass through turbulent markets.


Dear readers,
The interplay between asset classes can make you feel lost. Bitcoin and stocks are tightly correlated until bitcoin disconnects and go on a massive bull run. Stocks and bonds move oppositely to one another until periods of high inflation cause both to sell off in tandem. Like wading in the vast ocean of stars in the night sky, are you having difficulty connecting all of the dots?

Correlations are the compass. Asset classes are related, and when the relation between them shifts, our job as analysts is to identify and explain the changes.
Today, we’ll be discussing how each major asset class that we follow is correlated to others in the short and long term, how they shift over time, and what we can infer.

Voltage helps you solve the biggest problem with Lightning nodes and scaling. No more headaches with maintenance, reliability, or uptime issues. Voltage makes running Lightning instant and now easier than ever. These radical improvements to Lightning empower startups and enterprise brands to bring incredible applications and services to market. You can also spin up a personal node and pay by the hour. Scale your infrastructure as fast as Lightning itself.
Create a node in less than 2 minutes, just visit voltage.cloud
Today’s topics
Short-term is noise, long-term correlations offer signal.
Correlations evolve through time.
Bitcoin’s strong relationship with equities.
Zooming In
Over the short term, correlations provide spotty alpha and are mostly influenced by macro fluctuations. They are also most capitalized on by professional traders with high-speed algorithms at their disposal. But this is a publication for more traditional investors. And investment signals are difficult to derive from short-term correlations. We can, however, use them to understand inter-asset relationships better.
For example, when looking at our TBL 3-Month Correlation Matrix, 10-year and two-year Treasury yields (10s and 2s) have had the strongest positive correlation, as both notes have increased in yield in tandem recently. This is because the current inflation wave is putting pressure on forward inflation expectations via the 10-year yield at the same time as forward policy rate expectations via the two-year yield are rising due to Fed hikes.
Bitcoin and the S&P 500 have been tightly correlated over the last three months as it has for the past five years. In the eyes of the market, bitcoin is a high-beta risk asset—highly sensitive to moves in underlying risk markets (equities)—which are currently declining amid monetary tightening.
Gold and the dollar have a strong inverse correlation. In this case, gold has depreciated against the dollar substantially as the dollar is reaching multi-year highs against all its major pairs. During an inflationary bear market, even safe-haven assets like gold do poorly relative to the dollar.

Another is 10-year real yields and the S&P 500. As real rates rise, it tends to choke off growth and signal to the Fed that its policy measures are working. Real yields are extremely important to monitor right now to understand the state of risk assets.
What changes as we zoom out to the past 12 months? Not much, but we start to get a better understanding of how these relationships shift over time.
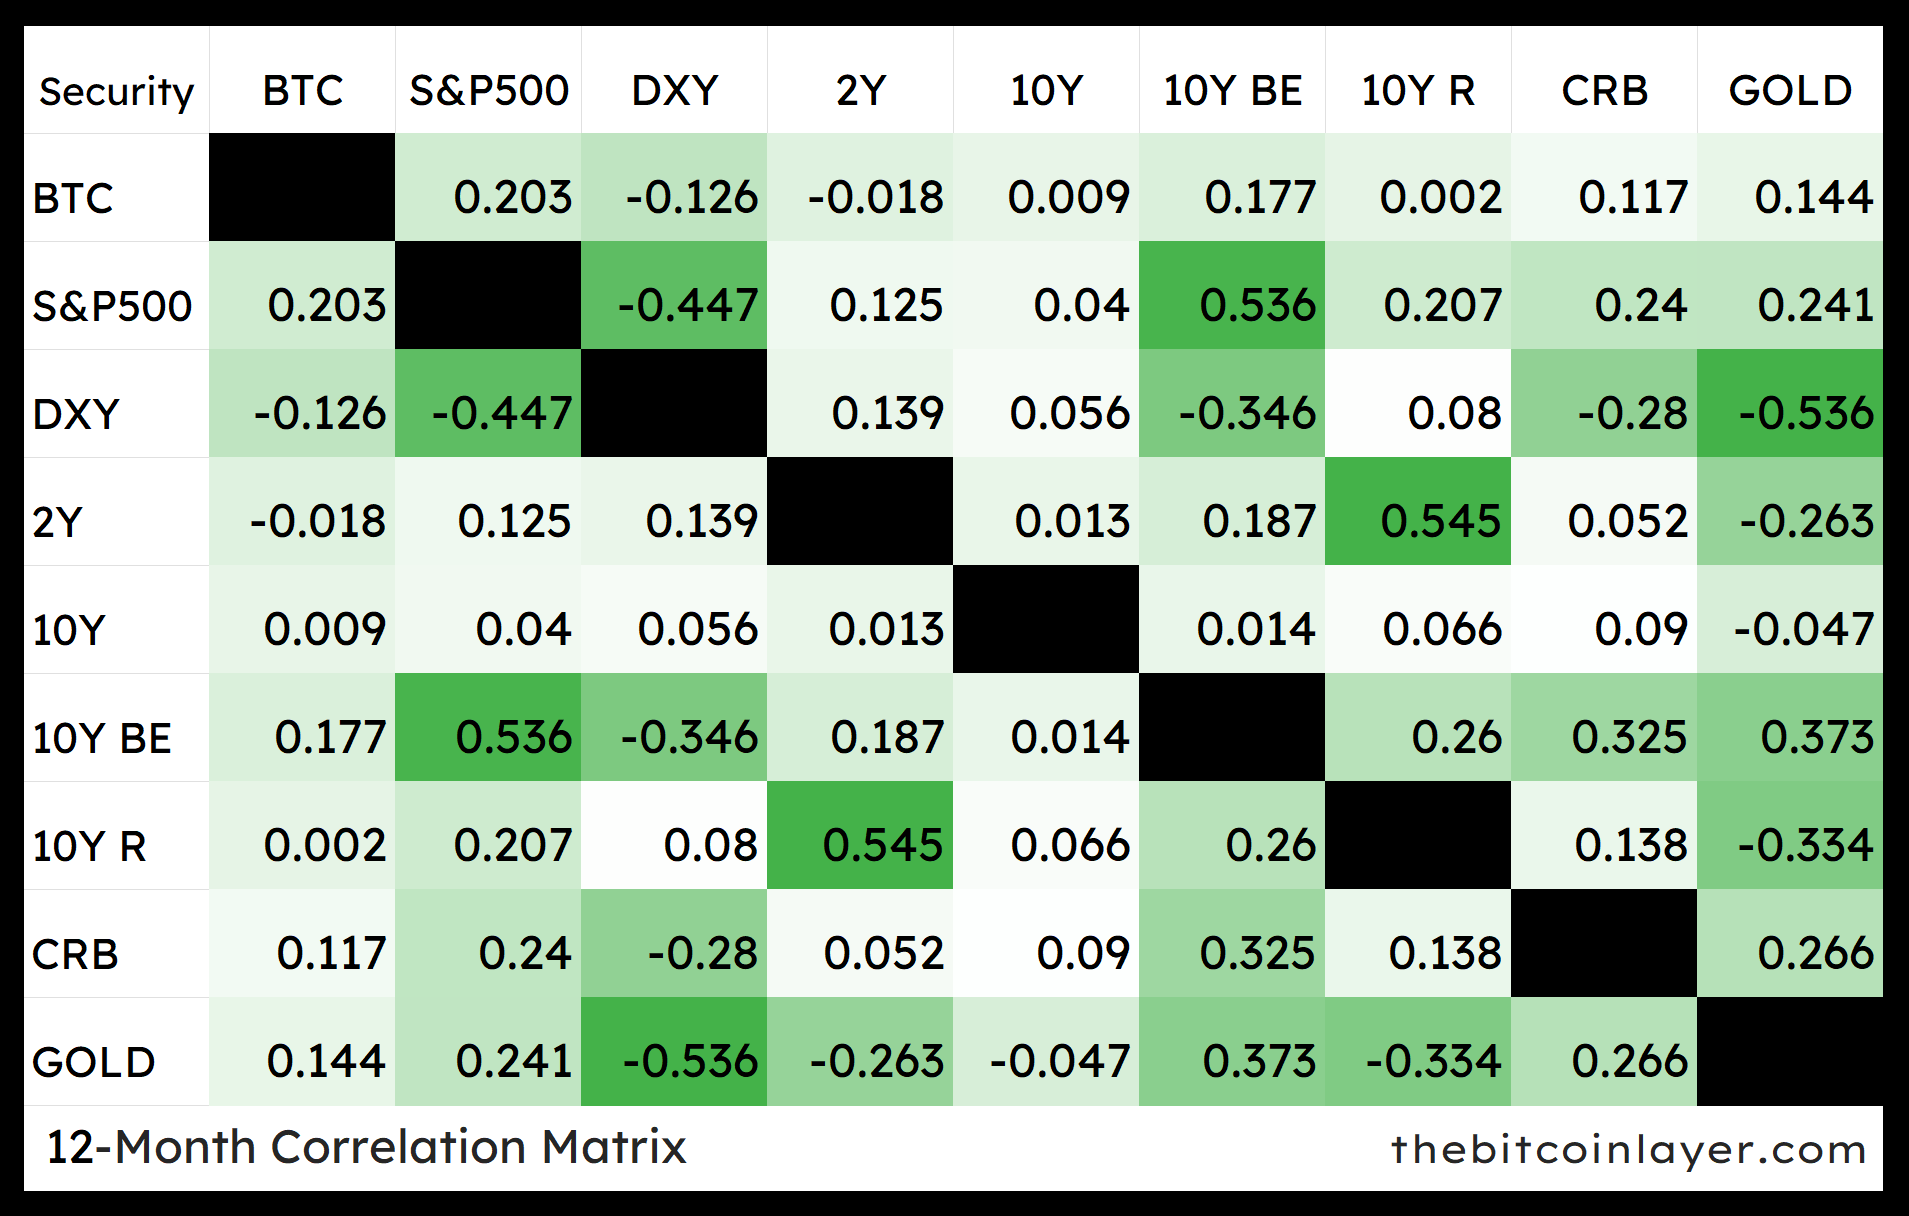
The 2s/10s correlation vanishes, and the strong correlation between bitcoin and the S&P 500 also dissipates because bitcoin started selling off first in November, several months before the S&P.
Monitoring these correlations can help identify measurable shifts in them over time and assist in the cyclical nature of markets research.
Zooming Out
Long-term correlations provide much more signal.
Our TBL 5-Year Correlation Matrix measures weekly correlation between these assets, unlike the daily correlation we’ve used for the previous matrices, it zooms much further out. It answers: how do these assets behave with one another through different phases of the economic cycle?

Some takeaways? Bitcoin and the S&P 500 have a very strong correlation over five years, which helps us in concluding that bitcoin mostly trades as a risk asset. The dollar index—DXY—shows a strong negative correlation with the S&P 500, gold, bitcoin, and the CRB commodities index, in that order. This order can be interpreted as the best-to-worst list of hedges against a strong dollar.
At The Bitcoin Layer, we are watching these correlations and their time series to extract signal for readers. Today we are introducing some of these concepts to you as part of our framework, and we promise more in-depth correlation studies to round out our analysis as a global macro research provider.

Introducing TBL Professional, our new institutional-grade product. If you’re a professional investor or institutional client looking for unfettered access to our advance macro framework, email us today or upgrade your subscription here:
Bitcoin’s Shifting Role
We have short and long-term correlations. Over the long term, bitcoin trades with risk assets, but over the short term as monetary policy stays restrictive, it could outperform risk—the marginal bitcoin outperformance during the last phase of tightening is the precedent for this.
A five-year chart of the correlation between BTC and SPX is very telling: March 2020 was the catalyst for a two-year stint of positive correlation between bitcoin and equities:
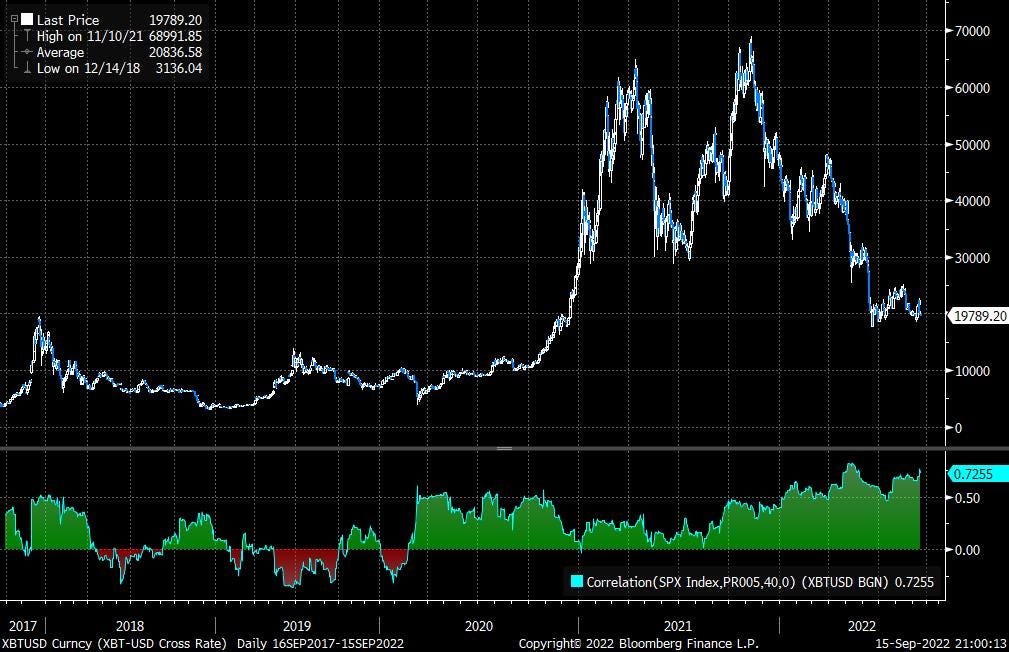
This begs the question: when could bitcoin and equities finally detach from the hip? Their inseparable nature of the last two years could be partly attributed to the age of easy money. Does it change now that we have gone toward a more restrictive policy?
Look back at the red troughs during 2018 and 2019. At the tail end of the Fed’s last rate hike cycle, the Fed was forced to pause and ultimately make a series of rate cuts; this is the same period that bitcoin marginally outperformed the S&P 500 and broke correlation to the downside.
Bitcoin outperformed the S&P 500 the last time that speculation was discouraged through tight policy. A lot has changed since then. Bitcoin has roughly doubled in market cap, and the $20,000 level is establishing itself as the current fair value in the eyes of the market. Despite the choppiness in risk and the potential Fed policy blunder of overtightening, bitcoin is holding steady. Given its comparatively lower market cap to the S&P 500 and the fact that it doesn't have to contend with higher discount rates because it’s not a company, this could be the cycle where bitcoin structurally outperforms equities for a meaningful period of time. Closely watching daily and weekly correlations will assist in providing any such signal to you.
We will continue watching this $20,000 area closely, especially relative to equity performance, moving into the Fed’s “higher for longer” period for its policy rate.
Until next time,
Nik & Joe
The Bitcoin Layer is sponsored by Voltage: provider of enterprise-grade Bitcoin infrastructure. Create a node in less than 2 minutes, just visit voltage.cloud

You guys seem to be the only people who are not bearish on BTC currently. It's going to be an interesting period! Question: what is more dangerous to BTC price levels, rate increases or the recession/depression they will likely cause? I.e. will BTC resilience be tested most this year or next?