Bitcoin's Longest Bear Market Ever
After being battered for 423 days from interest rate repricing and Ponzi scheme balance sheet contagion, supportive conditions for bitcoin are coming into focus as a Fed pause looms.
Dear readers,
Between the most aggressive Fed rate hikes in history, bitcoin-adjacent crypto firms collapsing like dominoes, and bitcoin miners burning through reserves or filing for bankruptcy, bitcoin has been locked in an amalgam of market forces that have cultivated the longest bear market in its 14-year history.
As fear sets in that this downtrend will persist forever and Jerome Powell will hike Fed Funds into the stratosphere, we have growing suspicion that risks are now skewed to the upside for bitcoin and other risk-traded assets.
Voltage helps you solve the biggest problem with Lightning nodes and scaling. No more headaches with maintenance, reliability, or uptime issues. Voltage makes running Lightning instant and now easier than ever. These radical improvements to Lightning empower startups and enterprise brands to bring incredible applications and services to market. You can also spin up a personal node and pay by the hour. Scale your infrastructure as fast as Lightning itself.
Create a node in less than 2 minutes, just visit voltage.cloud
Bitcoin’s second hike cycle and first protracted global recession have catalyzed its longest bear market on record.
Our friend TXMC made this chart mapping the fractals of every bitcoin bear market, starting at the peak of the bull market and drawing all the way to the total percentage loss of each cycle.
As you can see, the cycle we currently find ourselves in is the most drawn-out bear market bitcoin has experienced, but it’s also the best performing. As bitcoin has grown its liquidity profile, so too has its ability to absorb sell pressure during de-risking periods in markets—this helps to explain the lower downside relative to its previous three bear markets:
2011 Bear Market
Duration: 163 days
June 8th, 2011 - November 18th, 2011
2013-2015 Bear Market
Duration: 406 days
December 4th, 2013 - January 14th, 2015
2017-2018 Bear Market
Duration: 364 days
December 16th, 2017 - December 15th, 2018
2021-2022 Bear Market
Duration: 423 days
November 8th, 2021 - Today, January 5th, 2023
*(Current Low on 11/21/2022 at 378 days)
Each leg down in this bear market has been smaller in percentage terms than the last, forming the current base at ~$17,000 BTC/USD, where we find ourselves today. The strengthening investor sentiment toward bitcoin is palpable—it has sat dormant for two months while the S&P 500 keeps edging new lows. For those keeping score, buyers of last resort were scooping up bitcoin at $67 in July 2013; now they are stepping in to buy bitcoin at 250x that. Bitcoin’s market-ascribed value is rising, as showcased by investor willingness to defend a higher market floor, cycle after cycle.
Optimal risk-adjusted returns can truly only be achieved if asset-native debasement insurance is part of one’s portfolio. Many investors seek yield in order to achieve positive real returns, with low-yielding debt forcing investors to pile on the leverage and enhance yields that are drowning beneath inflation in real terms. UK pension funds piled on leverage to enhance their UK gilt yields and got smoked when the selloff came, as did an ungodly number of “crypto” firms. Many more will fall victim to their own yield-reaching strategies as credit conditions tighten in 2023. Bitcoin offers debasement insurance in its scarcity, allowing portfolio managers to set it and forget it rather than reach for yield and run the risk of overextending themselves.
Price is truth. This bear market has exhibited a staircase-like decline; successive legs down in price—more prudent, rational market behavior than 2011’s drawdown, which was essentially one vicious decline. A less erratic, more measured asset is birthed where there was once a volatile and highly speculative infantile one. To those opining on bitcoin’s lack of maturation, we encourage you to observe this.
Successively lower percentage declines are considered as the fair value floor during every subsequent cycle. That’s not indicative of a dying asset, that’s indicative of an asset that is growing increasingly valuable in the eyes of market participants:
Bitcoin’s bottom is forming, a Fed pause is in sight — risks are now skewed to the upside.
Its tepid, stagnant price action has compressed bitcoin's volatility to a five-year low. The aforementioned deep fair-value territory has seen bitcoin’s price be staunchly defended by major money managers, creating this period of extremely low volatility:
The index is the rolling 30-day annualised volatility of the daily time-weighted average price of bitcoin.
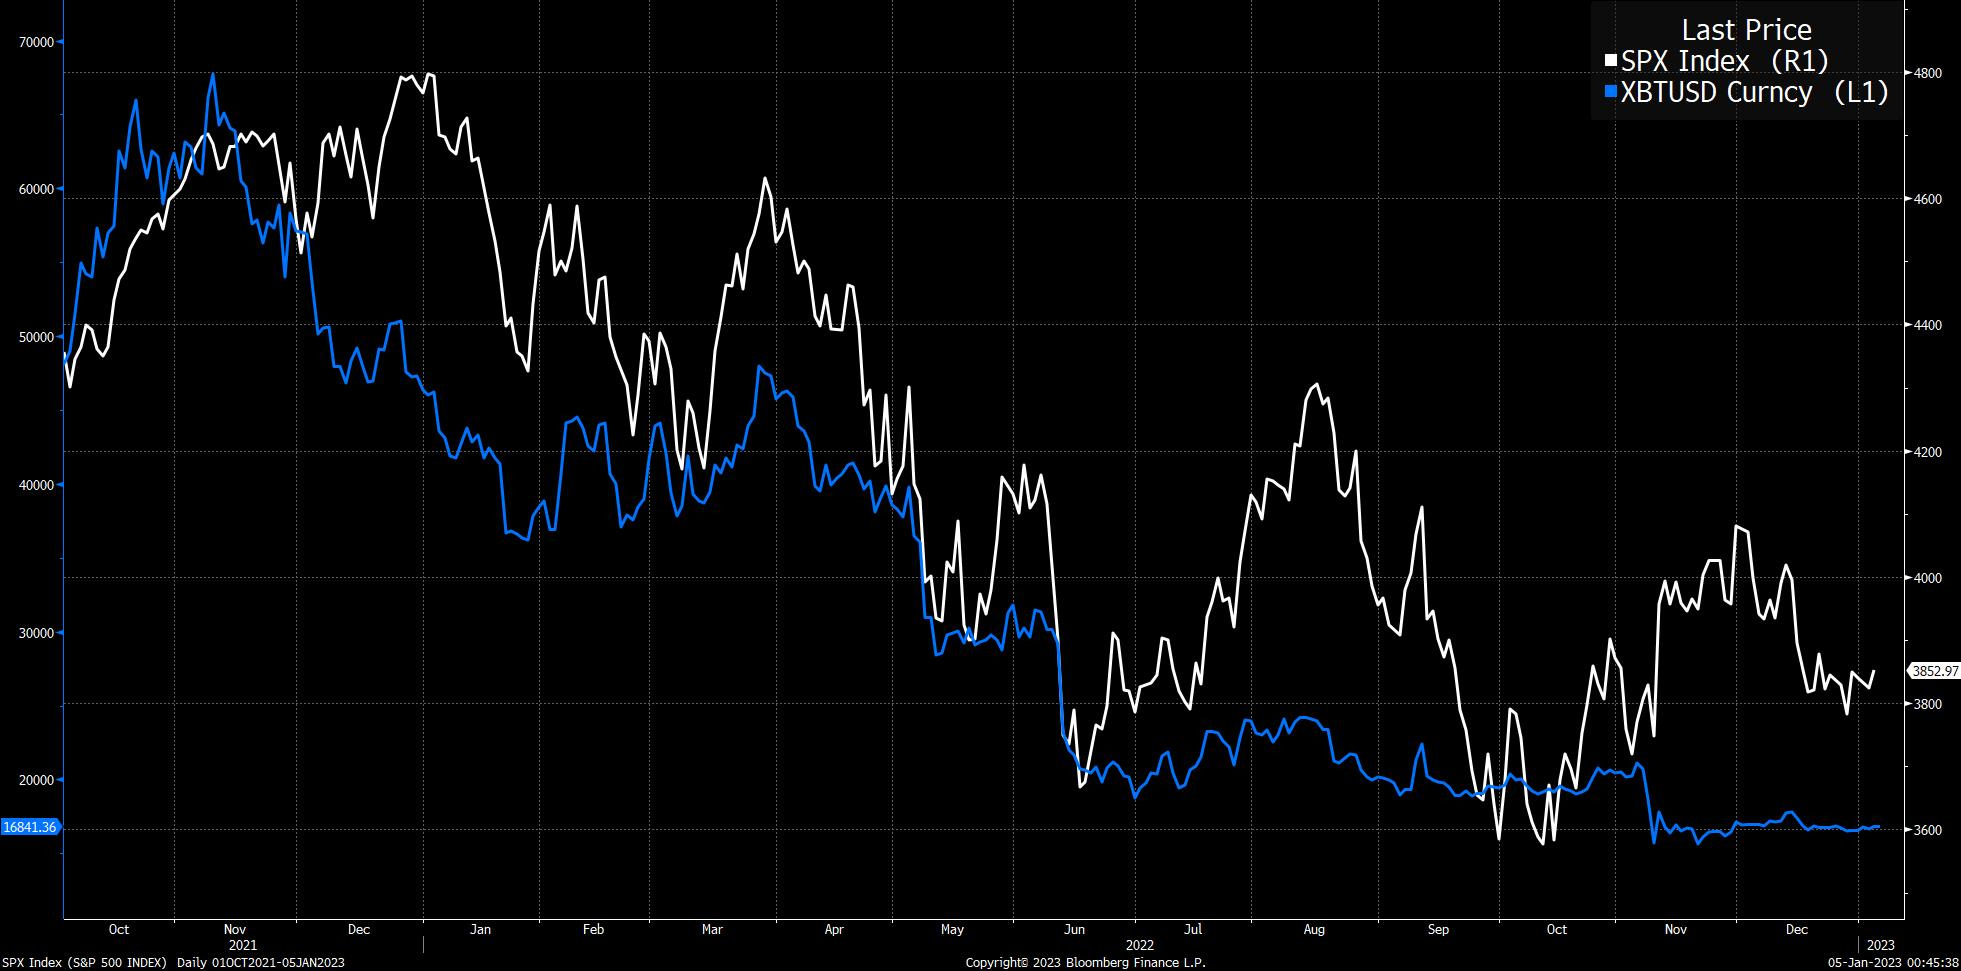
The prevailing direction of this bear market has been down in a stairstep-like pattern, with very few market rallies to make up some lost advances, as we see in the S&P 500. Whereas the S&P 500 has had three separate price rallies of 10% or more, bitcoin has had no materially significant rally:
Note how bitcoin’s correlation to the S&P 500 movement has waned since the beginning of the downturn. Whereas before it was leading the index in selling off and rallying alongside it, it has now completely flatlined and is less responsive than the S&P 500. This bodes well heading into 2023. As bitcoin, with no earnings component has shed 75% of its market cap, the onus is on equities to face the brunt of the selloff as corporate earnings contract this year. Equities and bitcoin repriced as interest rates rose, but bitcoin’s lack of a balance sheet shelters it from the risks that loom over other risk assets this year.
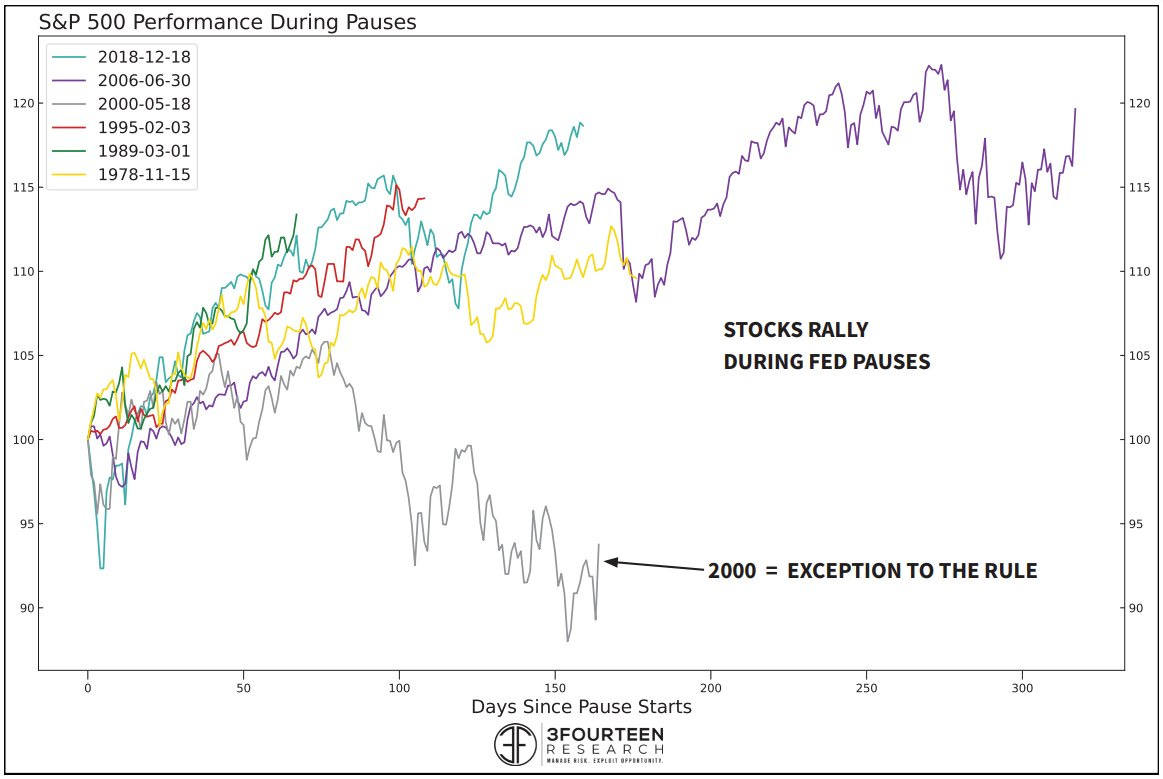
This is bitcoin’s first extended, global synchronized hiking cycle. Bitcoin has gone through one notable period of hikes from the Fed up until 2018 when other world central banks kept policy loose. Now that risk assets have faced the brunt of interest-rate-risk repricing and the rates market is pricing in a late-Q1 or early-Q2 pause to hikes, equities and bitcoin stand to have a positive initial reaction rally. The S&P 500 has historically rallied off the back of a Fed pause—apart from 2000 when they were still trading at overvalued 28 times earnings:
Bitcoin similarly rallied in 2019 during the last Fed pause it experienced. Leading into the pause, MVRV Z-Score reached a depth of 0.21, which lines up with today’s MVRV Z-Score of 0.21. As we approach this year’s Fed pause, bitcoin is at roughly the same valuation level relative to the network’s average purchase price as it was in 2019:
As inflation trouble turns into outright deflation fears, the setup for a Fed pause is materializing at double-time.


Growing fear in markets means that a bottom is approaching, and as we near peak pessimism and bitcoin’s bottom continues solidifying, the risks for further downside are waning.
Until next time,
Joe & Nik
The Bitcoin Layer does not provide investment advice.
The Bitcoin Layer is sponsored by Voltage: provider of enterprise-grade Bitcoin infrastructure. Create a node in less than 2 minutes, just visit voltage.cloud


