Economic Pulse Check & TBL Liquidity Cycle Update: TBL Weekly #145
Dear Readers,
Amidst all that is happening around the globe, we want to give you guys a break by providing you with some fundamental signals on where the US economy stands. Why has economic data come back into TBL’s spotlight? Because ‘growing our way out’ of deficits (charts below) requires continued resilience in the US economy.
In today’s piece, we will dive into:
The rather subdued impacts of tariffs on inflation so far.
The US labor market’s resilience.
A TBL Liquidity Cycle update
So, without further ado, let’s dive into TBL Weekly #145.
Is bitcoin’s next parabolic move starting? Global liquidity and business cycle indicators suggest it may be. Read the latest report from Unchained and TechDev, analyzing how global M2 liquidity and the copper/gold ratio—two historically reliable macro indicators—are aligning once again to signal that a new bitcoin bull market may soon begin.
The Financial Freedom Report is a weekly newsletter from the Human Rights Foundation (HRF) that tracks how authoritarian regimes weaponize money to control their populations and suppress dissent. It also spotlights how freedom technologies like Bitcoin are helping everyday people reclaim their financial independence and freedom.
A one-of-a-kind newsletter connecting the dots between financial repression, geopolitics, and emerging tech.
Smart macro analysts don’t just watch the Fed. They watch the world.
Our videos are on major podcast platforms—take us with you on the go!
Apple Podcasts Spotify Fountain
Keep up with The Bitcoin Layer by following our social media!
YouTube X LinkedIn Instagram TikTok
Inflation
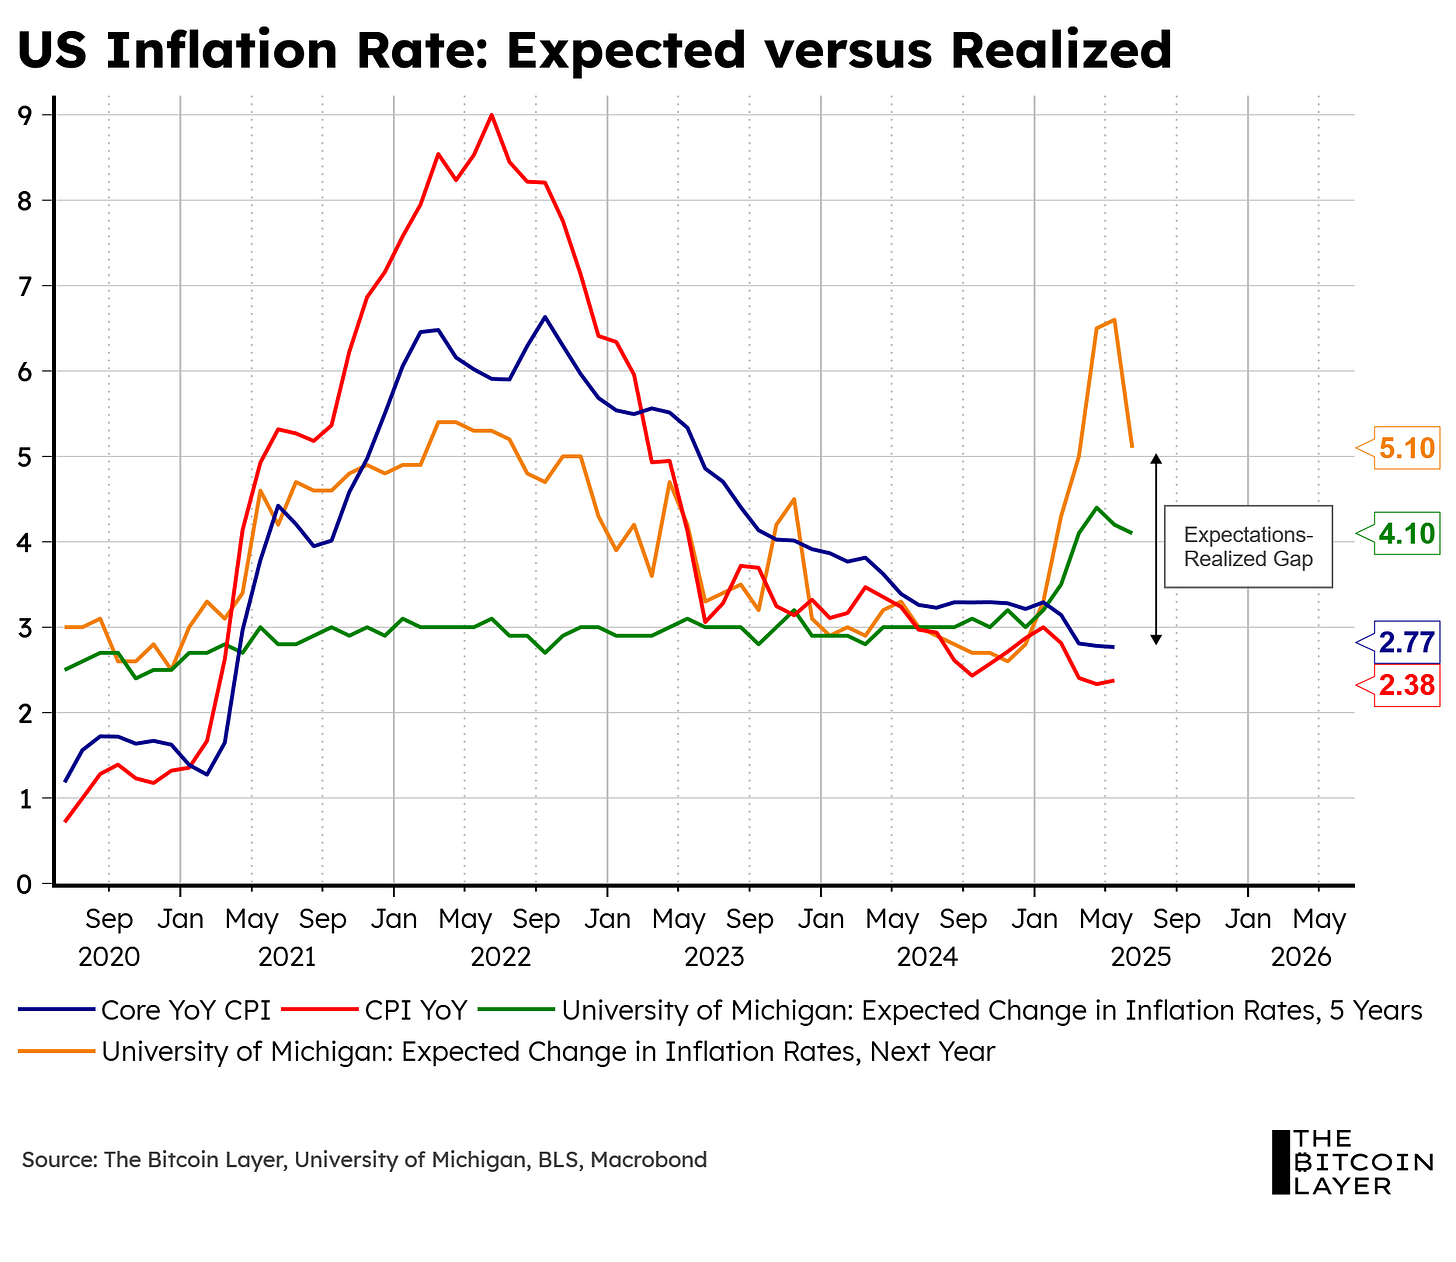
Currently, there seems to be an ongoing battle between expected inflation and realized disinflation:
Consumer surveys continue to show elevated inflation expectations within the next 1-5 years, given tariff uncertainty (although less so now than a few months ago), while material data shows little to no signs of such inflationary concerns. To be fair, we do see signs of inflation on goods that tend to be imported into the US:
Looking at major appliances (which are part of US imports), we see a massive spike in inflation (the highest since the 2020 supply-chain/COVID issues):
However, looking at the broad CPI dashboard above, most things show signs of cooling (just look at vehicles, information & technology, and apparel).
All in all, the battle between expected inflation versus realized disinflation as a result of tariffs seems to be dominated by the realized camp so far.
But why? Well, there are many factors at play.


