Dear readers,
With the past week of Fed speak, I had to step away from all the rhetoric and get back to basics—price charts. Today’s chart pack will be a pure price study, narrative-free until the end.
Yields across the world have, since late October, been tracing out a top. With the peak in yields now at least a quarter year behind us and a sudden pop in yields over the last few days, prices require refreshed analysis. Where are we now?
Today’s Charts
2-year Treasury yields
10-year Treasury yields
Dollar index
S&P 500
CDX High Yield
Bitcoin
Crude oil
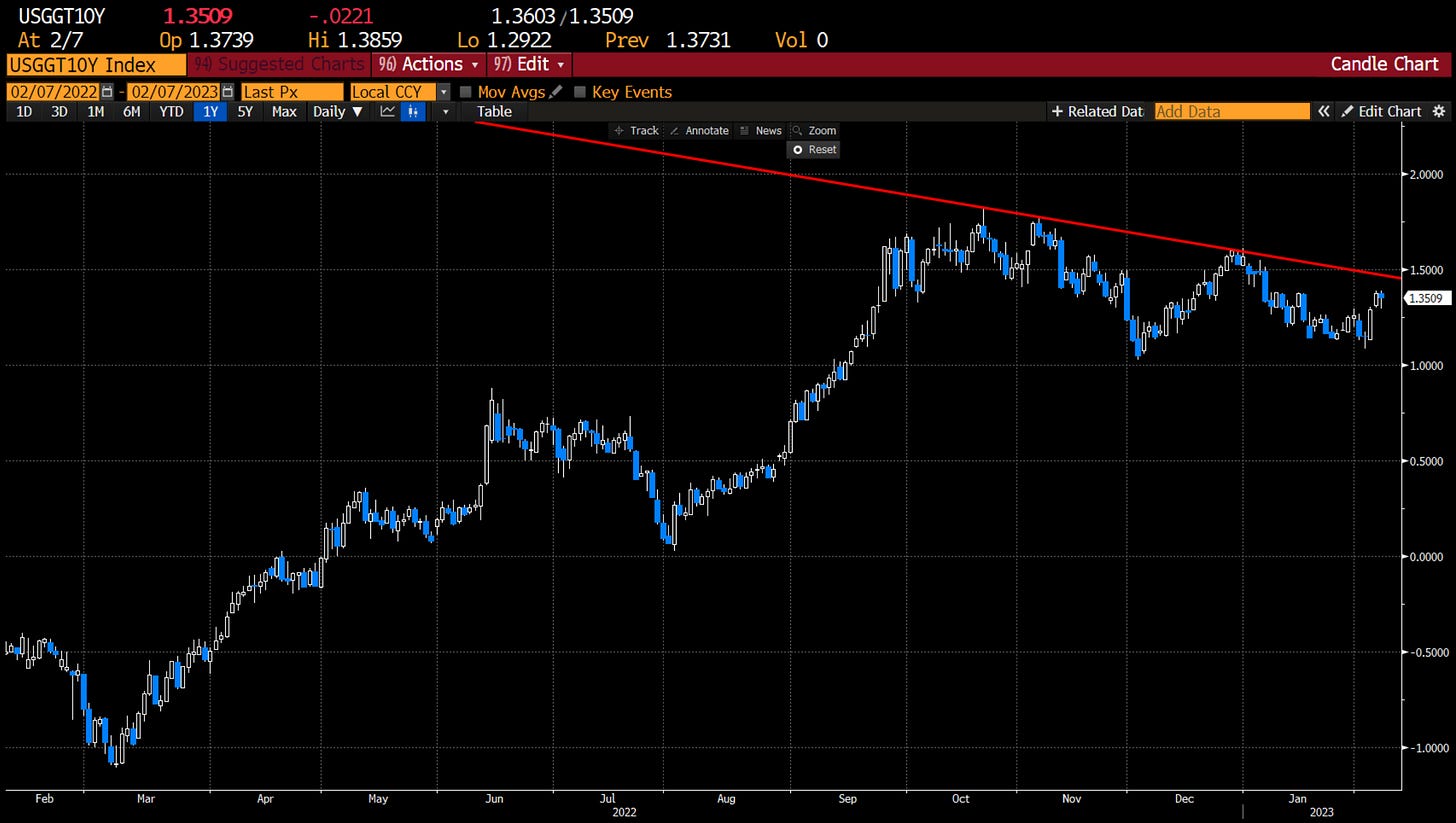
10-year German Bund yields
30-year Treasury yields
Summary
2-year Treasury yields
Current Fed Funds are around 4.58%. While Treasury bills out to one year of maturity yield higher than the Fed’s target rate, (1-year T-bills currently yield 4.9%), all other Treasury yields remain inverted to Fed Funds. Starting with 2s.
I now believe that Fed Funds will serve as a cap on 2s, now that they have traded inverted for longer than a full FOMC meeting period. That would put today’s 2-year yield of 4.43% very close to the top end of its range.
Long away is the threat of 5% 2-year yields, but let’s look at some of the more nearby levels of resistance on this rate. First, we have the local high of 4.52% to start the new year. This area, along with the fact that 4.5% is the lower bound of the Fed Funds target window, should serve as an important behavioral swing point for the front end of the yield curve. Summarized: if 2s trade above materially above 4.52%, you’re all of a sudden bringing 5% into question. If 2s stay below this area and close the gap (yellow circle area from over the weekend) around 4.3%, we are back into settling 2s below Fed Funds, renewing the narrative that this hiking cycle has officially gone too far in the market’s eyes.
The 4% area should also serve as supportive until something really changes—a slew of aggressive rate cuts is not priced into the market, nor should it be right now. Two-year yields reflect this, making the 4-4.5% range a comfortable consolidation range. A more predictable front end is a stabilizing force, and the price action of 2022, during which 2s had several rapid advances in yield, was far from stabilizing.
10-year Treasury yields
Ten-year Treasury yields show more strength than the front end—longer-term investors are more resolute that growth and inflation are slowing globally, evidenced by the return of demand for duration, or price appreciation due to falling interest rates. Yields over 4% were a gift, in hindsight, to those that participated. But above 3.9%, yields that are much higher than 4% would be entirely possible, making the local high of 3.9% a key area of resistance on this chart. There is also a descending trendline coming in around 3.75% over the next few days which should be an interesting test for 10s.
Recent price action has me believing that the 3.5% area is going to become a magnet over the coming months. The market is settling into a reality of 10s trading 1% or more inverted to the policy rate. The price chart suggests the same—even three days of very weak price action in Treasuries couldn’t get 10s near its local high of 3.9%. Further testing of the 3.5% area seems a likely outcome as we continue seeing disinflation (my words, not Powell’s).
Under the hood of 10s, we can see that real yields are tracing out marginally lower highs, an indication that investors are thirsty to lock in long-term inflation-protected yields:
The non-traded byproduct of 10s and 10-year real yields is the inflation breakeven calculation. This what the inflation market sees in the US over the next 10 years, consistently lowered expectations of inflation, now only 2.3%:
This is a recipe for Treasury buying in general, although not a cause to send yields materially lower. Right now, 3.5% seems like a fair range.
Remind yourself of last year’s hysterics around rising yields as context for what a more calm yield environment could mean for risk assets, which we will cover shortly. Also remember that Treasuries are not in a bursting bubble; they are at the core of the world’s financial system. Prices of Treasuries have been supported for several months (lower yields) due to natural demand from buyers both domestic and international as global growth and inflation slow. It’s not because of Fed QE, the pricing in of more Fed QE, the pricing in of yield curve control, or anything remotely bailout-derived. Simply raw demand for the dollar system’s highest quality asset.
Dollar index
Once the dollar broke its 2022 uptrend in November, its price has been retreating heavily. The strong dollar is empirically a tight financial condition on the rest of the world, making a weakening dollar generally positive for risk. We are still about 2% shy of the local high in the dollar, which in itself is miles away from the peak tightness of 2022. I would also point out that yesterday’s candle after three days of a rally suggest that the current regime of a weaker dollar (relative to 2022) is intact.
This chart is one of the loudest reminders that the macro regime of today is different than last year’s. Significantly.


