

Mean Median Mode: Continued Progress on TBL Liquidity
Our bi-weekly quantitative risk report for TBL Pros: June 11th, 2025 Edition


Dear Readers,

This week, we analyze the odd certainty that we are currently feeling. Welcome back to another edition of Mean Median Mode—a quantitative risk report summarizing bitcoin price analysis and global macro narratives to position investors and bitcoin watchers with the data that matters. So, without further ado, here’s our latest risk report.
Table of Contents
Report’s Main Highlight
Bitcoin: Technical Analysis
TBL Liquidity Analysis
Bitcoin: Correlation Analysis
Bitcoin: On-Chain Analytics
US Rates Analysis
Fed Watch
Money Market Analysis
US Economy Analysis

Is bitcoin’s next parabolic move starting? Global liquidity and business cycle indicators suggest it may be. Read the latest report from Unchained and TechDev, analyzing how global M2 liquidity and the copper/gold ratio—two historically reliable macro indicators—are aligning once again to signal that a new bitcoin bull market may soon begin.

Blockstream Jade Plus is the easiest, most secure way to protect your Bitcoin—perfect for beginners and pros alike. With a sleek design, simple setup, and step-by-step instructions, you'll be securing your Bitcoin in minutes.
Seamlessly pair with the Blockstream Green app on mobile or desktop for smooth onboarding. As your stack grows, Jade Plus grows with you—unlock features like the air-gapped JadeLink Storage Device or QR Mode for cable-free transactions using the built-in camera.
Want more security? Jade Plus supports multisig wallets with apps like Blockstream Green, Electrum, Sparrow, and Specter.
Protect your Bitcoin, sleep better, stack harder. Use code: TBL for 10% off.
Report’s Main Highlight
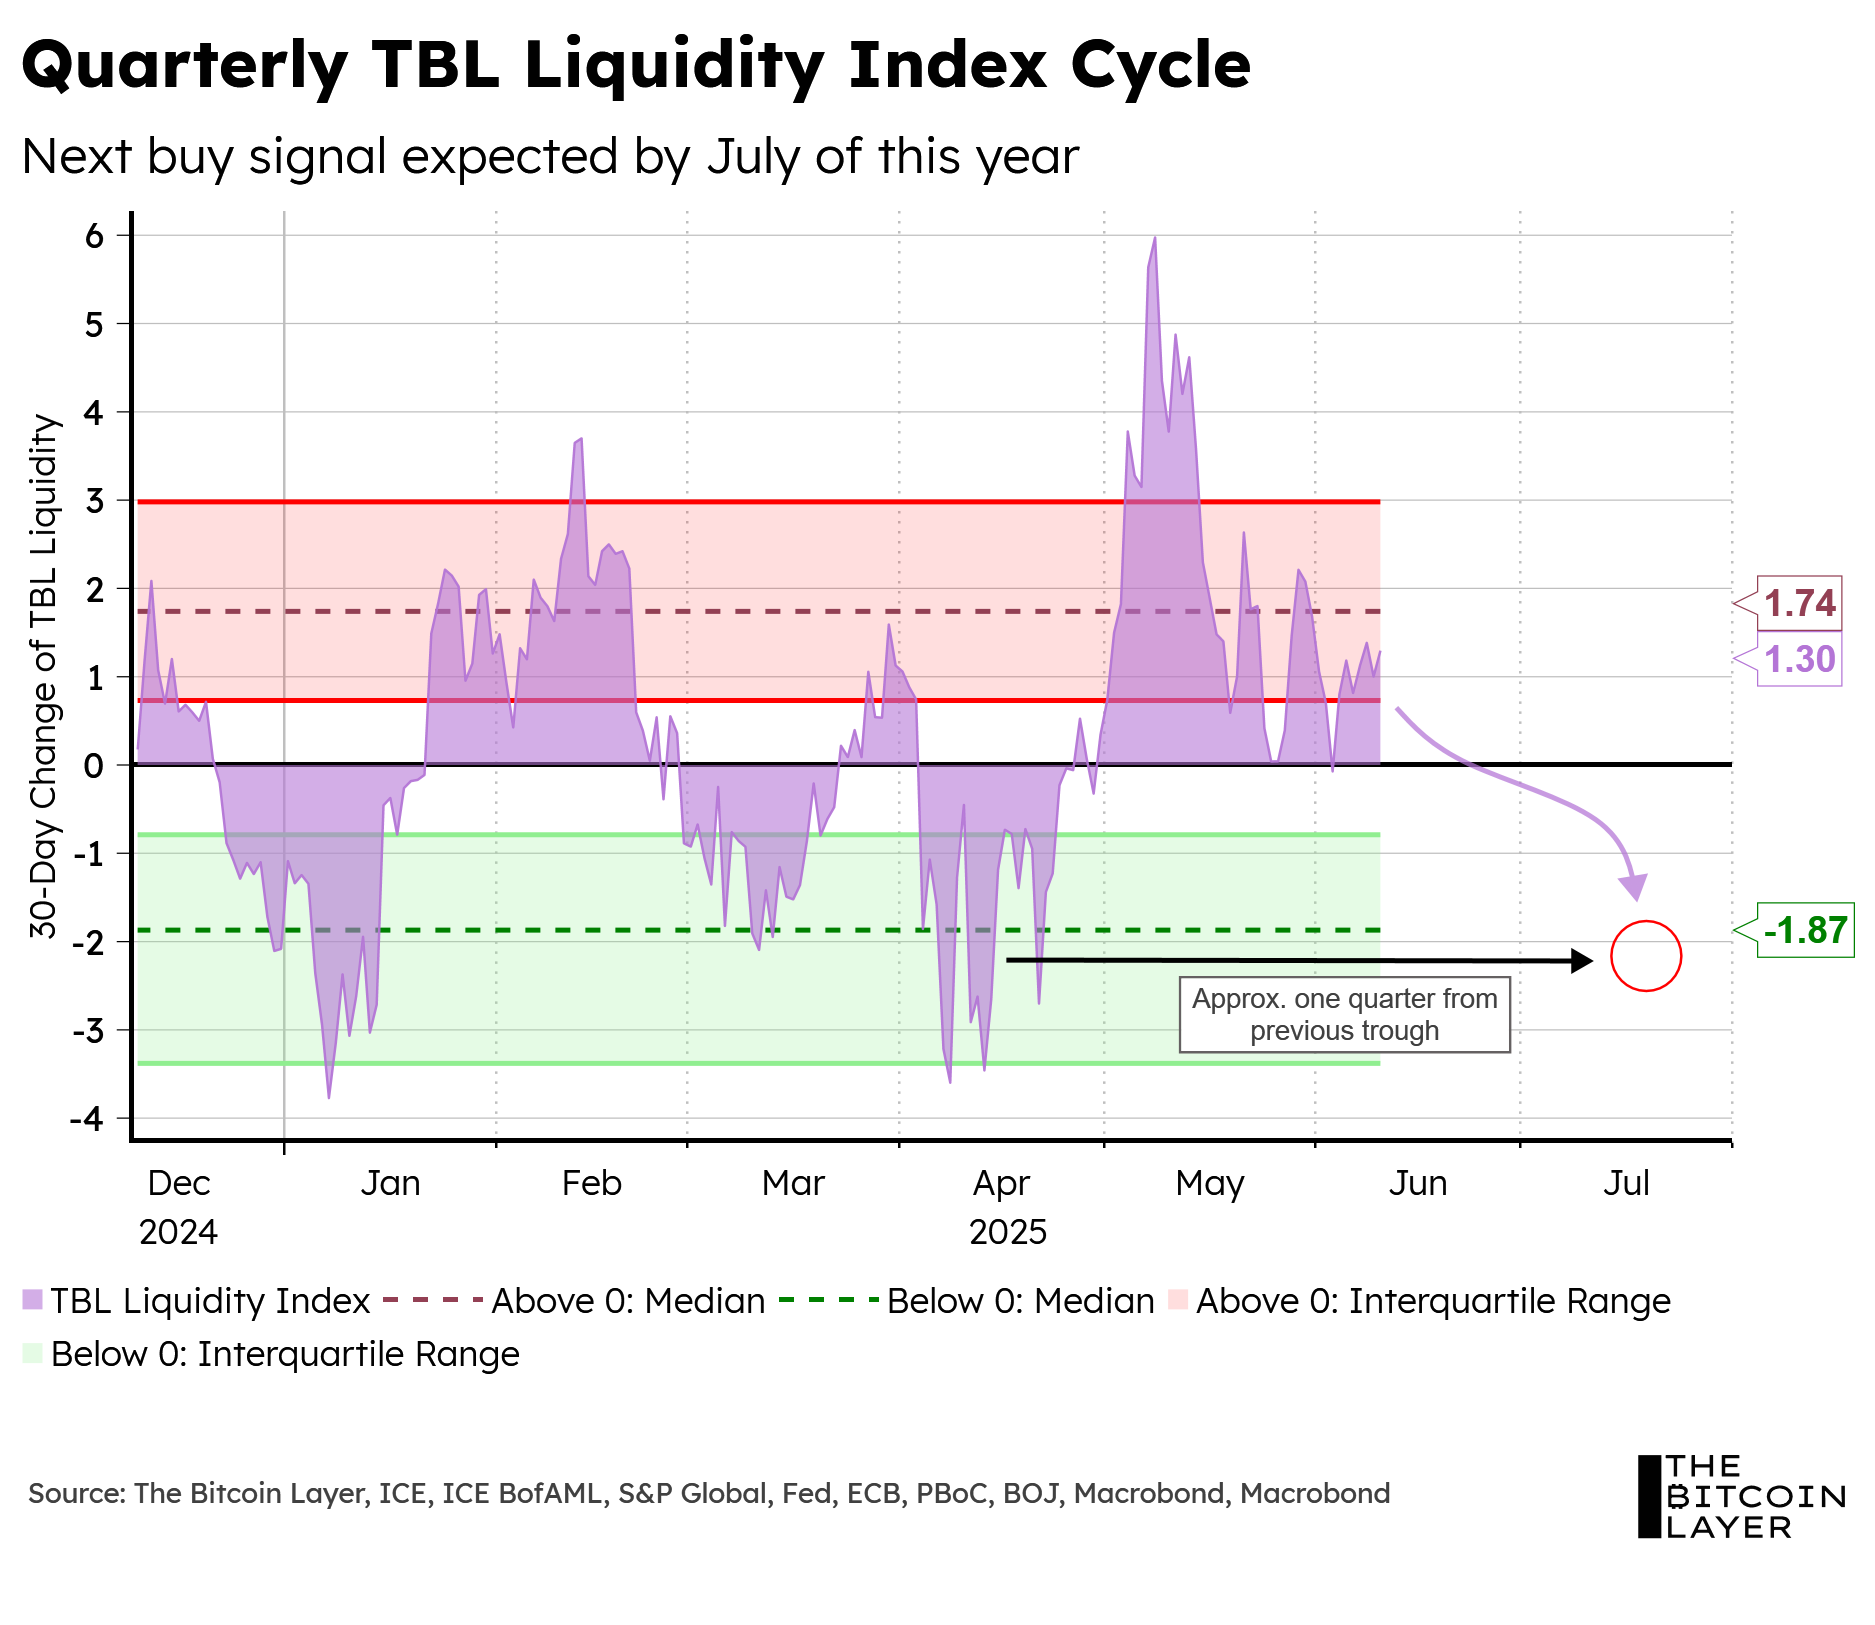
In a continuation of our latest TBL Liquidity cycle, our indicator continues to display signs of being in a downtrend.
We expect to approach the next liquidity trough sometime in mid-July, where we might get our next buy signal for risk assets.
We have also created some statistical channels in our liquidity cycles that provide us with some guidance. Namely, these channels allow us to create future liquidity expectations based on previous cycle levels, which consequently provide better buy-and-sell signals.
Within our analysis, we find bitcoin a bit less attached to our TBL Liquidity quarterly cycle than stocks; this is a positive result in that our model is good at identifying systematic risk, which is ultimately what we aim to explain (hence the name TBL Liquidity).
With that in mind, we will continue to explore future buy-and-sell channels for bitcoin specifically within our model.

Bitcoin: Technical Analysis
High Time Frame
Bitcoin has shown some intriguing price action over the past two weeks. Since our last risk report, the price has indeed fallen below the support at approximately $106,800. We previously warned about the relatively large divergence between the RSI and its RSI-based MA. This divergence suggested a probable consolidation or a minor pullback. Ideally, we didn’t want to see a full candle close below the support line, but unfortunately, that did happen, prompting the RSI to dive below its MA. This was somewhat concerning, emphasizing the need for bulls to quickly reclaim territory. Failure to retake the support would significantly jeopardize bitcoin’s current momentum.
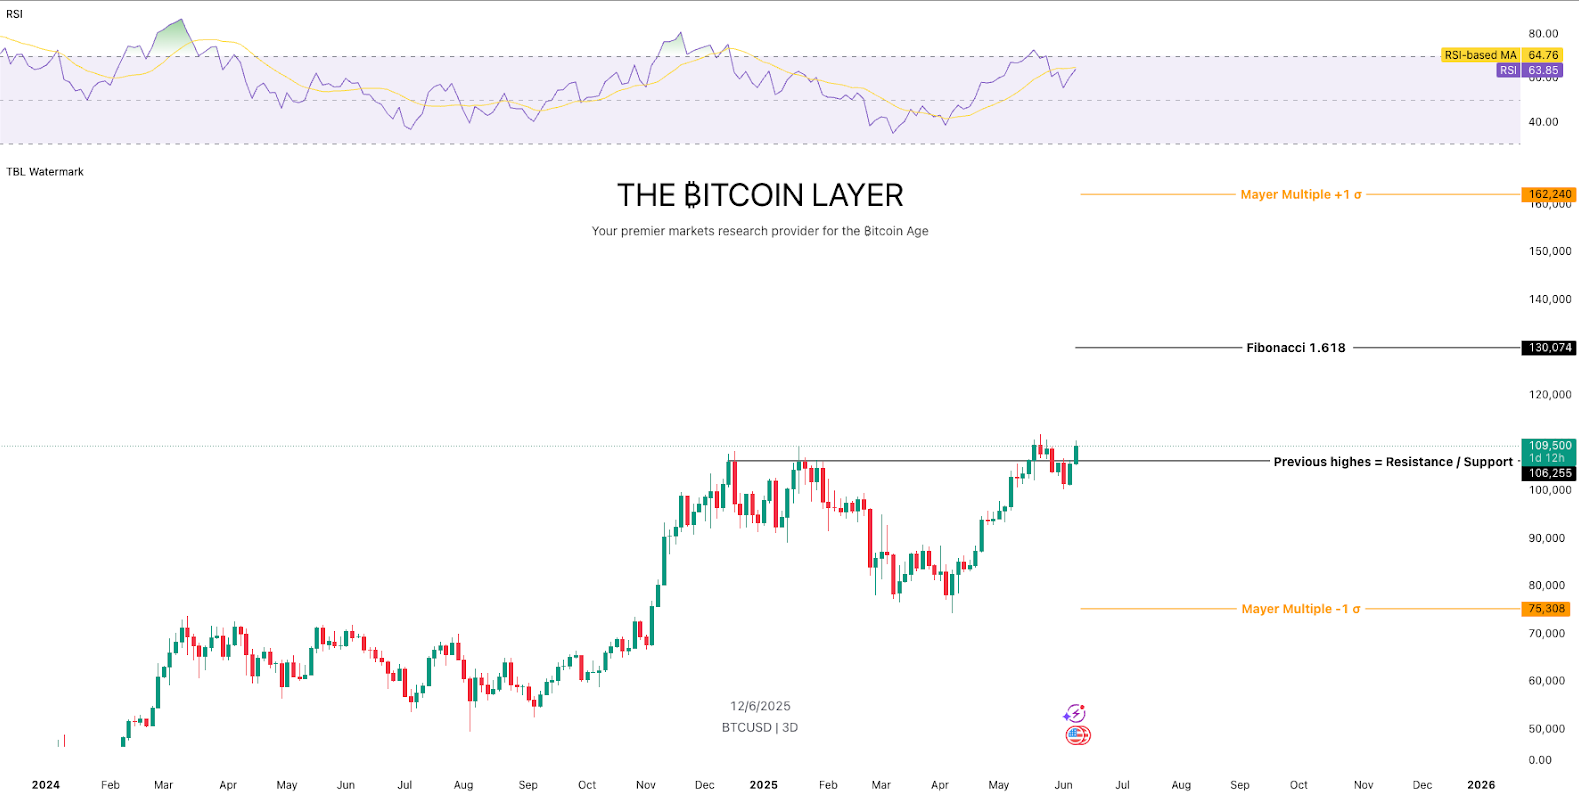
Fortunately, bulls stepped in aggressively, leading to impressive price action, which we’ll examine in greater detail in the ‘Low Time Frame’ analysis below. On the High Time Frame, the important task now is maintaining the support at $106,800. If this level holds, we believe new all-time highs are likely in the coming weeks.
Our initial target remains the Fibonacci Extension level derived from the consolidation over the past six months. We anticipate price consolidation between $130,000 and $160,000 during the next few months, which we would consider orderly price action accompanied by healthy flows. However, if the price overshoots this range, we believe we’d enter a phase of turbulent price action, marked by rapid surges followed by sharp pullbacks or potentially prolonged downtrends.
Low Time Frame
We’ve recently experienced some magnificent price action. There’s a common belief that markets often need a sell-off or some type of capitulation before resuming an upward trajectory. We witnessed exactly this kind of micro-capitulation on the Low Time Frame (4-hour chart) on the day President Trump and Elon Musk engaged in a public dispute on X. Interestingly, this micro-capitulation also aligned with Bob Loukas’s (Daily) Cycle Theory.

The price action clearly shows how bitcoin initially lost support at $106,800, then returned to retest this level and got rejected—a bearish signal. The digital equivalent of mudslinging between Trump and Musk provided a perfect catalyst for a sell-off.
This is where things became truly interesting. If bulls genuinely believe bitcoin should trade higher, such market inefficiencies represent potential opportunities. However, they first needed to prove it. Price subsequently dropped to approximately $100,000, at which point buyers stepped in decisively, creating a beautiful V-shaped recovery visible on the Low Time Frame.
We’ve marked the ‘drop-off’ point, which serves as an essential indicator. If the price recovers but gets rejected at this specific level, bears remain in control, and another leg down becomes likely. On the other hand, reclaiming this drop-off point signals that bulls are in control, suggesting price continuation to higher levels. Essentially, a failed bearish setup is inherently bullish, and vice versa.
Such a scenario can be likened to sports—for example, a match between Barcelona and Real Madrid. Even if Barcelona dominates possession, failing to score provides Real Madrid an opportunity to counterattack, potentially scoring or even winning. Not scoring keeps the opponent’s hopes alive, energizes their defense, and gives them confidence in the possibility of a successful counterattack. Similarly, bulls must convincingly demonstrate to bears that their moment has passed, forcing them to cover their shorts. When bears cover shorts, selling pressure dissipates, and additional buying pressure emerges, fueling further upward movement.
TBL Liquidity
Quarterly Liquidity Cycle
As we continue to improve the signal behind our TBL Liquidity metric, in this report, we will discuss some slight adjustments we have made to our previously identified TBL Liquidity Quarterly Cycle.
Using some statistical analysis, we’ve identified more accurate buy-and-sell corridors (as suggested by Brett, one of our TBL Pros):

These corridors were identified using some basic statistical analysis. First, we separated positive and negative values in the 30-day change of TBL Liquidity.
After that, we separately derived the interquartile range for positive and negative values, as well as the median value for both corridors (all of this using a 3-year time frame, as Howard, a TBL Pro, suggested from his personal work on correlation analyses).
We then placed buy and sell labels on the corridors, which allow us to gauge just how overbought or oversold the current cycle is (much like an RSI indicator).
The median buy value over the past three years has been -1.87, while the median sell value has been 1.74.
As discussed in a previous post, the average time between two peaks (or two troughs) is approximately 3 months. Accordingly, we maintain our next buy signal should come in at some point in July.
Let’s now overlay our predictions with both bitcoin and the S&P 500.