

Mean Median Mode: Setting Up for Uptober
Our bi-weekly quantitative risk report for TBL Pros: September 17th, 2025 Edition


Dear Readers,

Thank you very much for your patience, and welcome back to another edition of Mean Median Mode. For those of you who are new to TBL, this is our quantitative risk report summarizing bitcoin price analysis and global macro narratives to position investors and bitcoin watchers with the data that matters. So, without further ado, here’s our latest risk report.
Table of Contents
Signal Breakdown (under construction)
Bitcoin: Technical Analysis
TBL Liquidity Analysis
Bitcoin: Correlation Analysis
Bitcoin: On-Chain Analytics
US Rates Analysis
Fed Watch
Money Market Analysis
US Economy Analysis

This extended $75k–$110k range has caused some to wonder if the bull run is exhausted. But what if the on-chain evidence tells a totally different story? Join James Check (Checkmate of Checkonchain) and Connor Dolan for a data-driven discussion on what a maturing bitcoin market means for the road ahead. James will break down:
Institutions reshaping the cycle: ETF flows and institutional allocator demand setting higher floors
Chopsolidation: why time-pain in the $75k–$110k range signals resilience, not exhaustion
Conviction on display: heavy distributions absorbed while long-term holders remain in control
On-chain metrics show bitcoin has crossed the Rubicon—from a nascent store of value into a true institutional-grade asset class. This session will help you understand what that means for this bull market and beyond—and how you might position yourself appropriately.
Tuesday, September 30th at 3PM CT — online, free to attend.
Register now for early access to a new on-chain metrics report from Unchained and Checkonchain:

Blockstream Jade Plus is the easiest, most secure way to protect your Bitcoin—perfect for beginners and pros alike. With a sleek design, simple setup, and step-by-step instructions, you'll be securing your Bitcoin in minutes.
Seamlessly pair with the Blockstream app on mobile or desktop for smooth onboarding. As your stack grows, Jade Plus grows with you—unlock features like the air-gapped JadeLink Storage Device or QR Mode for cable-free transactions using the built-in camera.
Want more security? Jade Plus supports multisig wallets with apps like Blockstream, Electrum, Sparrow, and Specter.
Protect your Bitcoin, sleep better, stack harder. Use code: TBL for 10% off.
Signal Breakdown
As you all know from your TBL Research Dashboards, our current TBL Signal is under construction. We want to turn our research into more actionable content, but to do so requires a lot of iterations to put out the best possible product. We will keep you all posted on our progress with our TBL Signal.
Onto the analysis!
Bitcoin: Technical Analysis
High Timeframe
To be honest, the current setup looks eerily similar to that of July, when we wrote the risk report titled Time to Move. While not intentional, many of those topics will resurface in this report because we believe they, once again, contain the signal.
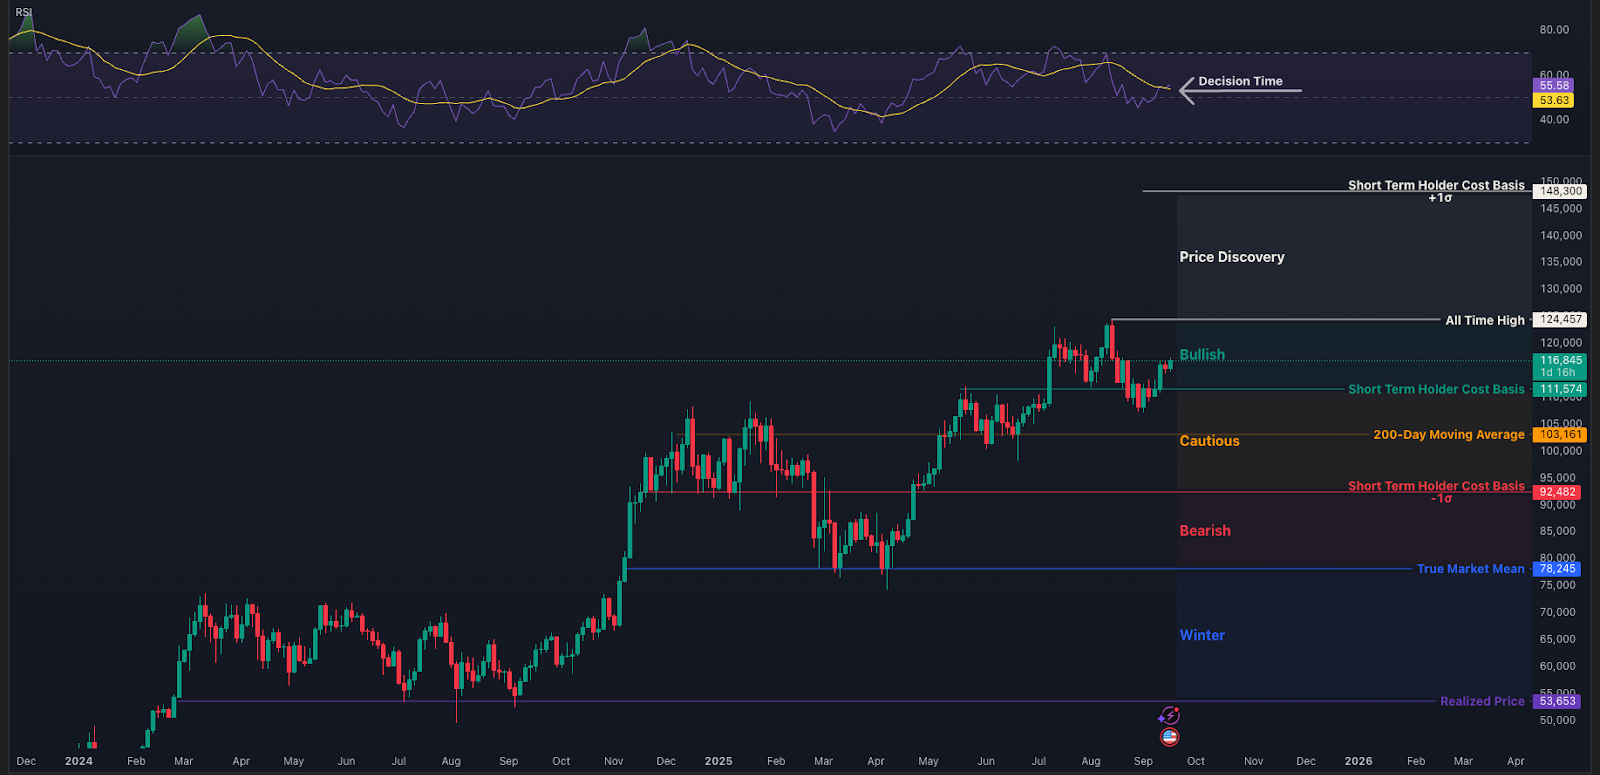
On the High Timeframe, specifically the 3-Day chart you may have grown accustomed to, we’ve been trading in the “Bullish” zone for some time now. Keep in mind that these zones and levels are dynamic, shifting over time.
There is significant confluence around the upper boundary of “Price Discovery.” As the chart shows, this level aligns with the top of the channel where Bitcoin has been trading for the past two years. It also coincides with the all-time high of BTC/GOLD in dollar valuation, the Vaulted Price, and the upper bound of the “Expected Price Move” in the Deribit options market for year-end.
The 3-Day RSI is currently above its Moving Average, suggesting a potential trend reversal. While false signals can occur—sometimes leading to choppy price action—this indicator usually provides a reliable directional bias.
For the sharp-eyed observer, it’s worth noting that the current candle doesn’t close until Thursday night, meaning there’s still room for rejection. Interestingly, this decision point arrives almost simultaneously with the FOMC announcement on the Federal Reserve’s policy rate.
As we’ve mentioned, Bitcoin’s current setup looks very similar to that of July 9th. At that time, the spread on the 3-Day Bollinger Bands was near an all-time low. This indicates a period of very low volatility, during which the bands gradually tighten. Historically, such low-volatility phases are followed by high-volatility moves. The seventh line, shown in gray, is not meant to signal when volatility will return—it could begin as soon as today with the FOMC decision, or it could take weeks.
Over the last six instances, the 3-Day RSI has had a 100% success rate in indicating the direction of the volatility breakout: two times to the downside and four times to the upside. While the direction is often reliable, the magnitude is much harder to predict.