

Mean Median Mode: Time to Move
Our bi-weekly quantitative risk report for TBL Pros: July 9th, 2025 Edition


Dear Readers,

This week, we bring in some new on-chain metrics as we attempt to make sense of this new consolidation step for bitcoin that started back in May. Welcome back to another edition of Mean Median Mode—a quantitative risk report summarizing bitcoin price analysis and global macro narratives to position investors and bitcoin watchers with the data that matters. So, without further ado, here’s our latest risk report.
Table of Contents
Report’s Main Highlight
Bitcoin: Technical Analysis
TBL Liquidity Analysis
Bitcoin: Correlation Analysis
Bitcoin: On-Chain Analytics
US Rates Analysis
Fed Watch
Money Market Analysis
US Economy Analysis

Stop treating bitcoin like any other asset. It’s time to build a long-term strategy and declare your financial independence. Unchained’s Financial Freedom Bundle is designed to help serious bitcoin holders secure their future by taking control of their generational wealth.
Request the bundle to get:
A premium bitcoin coffee table book, Foundations
A digital copy of our 2025 hardware wallet guide
An invite to an exclusive July macro strategy session with Tuur Demeester
First 100 to request a bundle receive a physical copy of Foundations.

The Financial Freedom Report is a weekly newsletter from the Human Rights Foundation (HRF) that tracks how authoritarian regimes weaponize money to control their populations and suppress dissent. It also spotlights how freedom technologies like Bitcoin are helping everyday people reclaim their financial independence and freedom.
A one-of-a-kind newsletter connecting the dots between financial repression, geopolitics, and emerging tech.
Smart macro analysts don’t just watch the Fed. They watch the world.
Report’s Main Highlight
🚨TBL Signal Breakdown Coming Back🚨
Quick note before we get started: we want to make sure we provide signal to all of you, as that is ultimately what our TBL Pros are looking for. We are bringing back our ‘Signal Breakdown,’ which you can find at the bottom of this report. So, without further ado, enjoy!
In this risk report, we’ve presented four distinct types of metrics in our on-chain section, each derived from different instruments and datasets. All pointing to the same conclusion: the market has found equilibrium. Participants have had ample time to reallocate and reposition.
The dealer has dealt the cards. Investors placed their bets Pre-Flop (after the Presidential Election), the Flop came when Trump took office, the Turn during Liberation Day and the tariff announcements, and now we’re at the River with the passage of the “Big Beautiful Bill.” It feels like we’re heading for the Showdown.
Time to Move.
Charts of The Week
In technical analysis, a 50-day moving average crossing above a 200-day moving average (or any short-term m.a. crossing above a long-term m.a., for that matter) is often referred to as a ‘Golden Cross.’
This technical pattern often indicates an upward momentum in price action.
As you can see from the chart below, bitcoin’s 50-day m.a crossed above its 200-day m.a on May 22nd of this year.
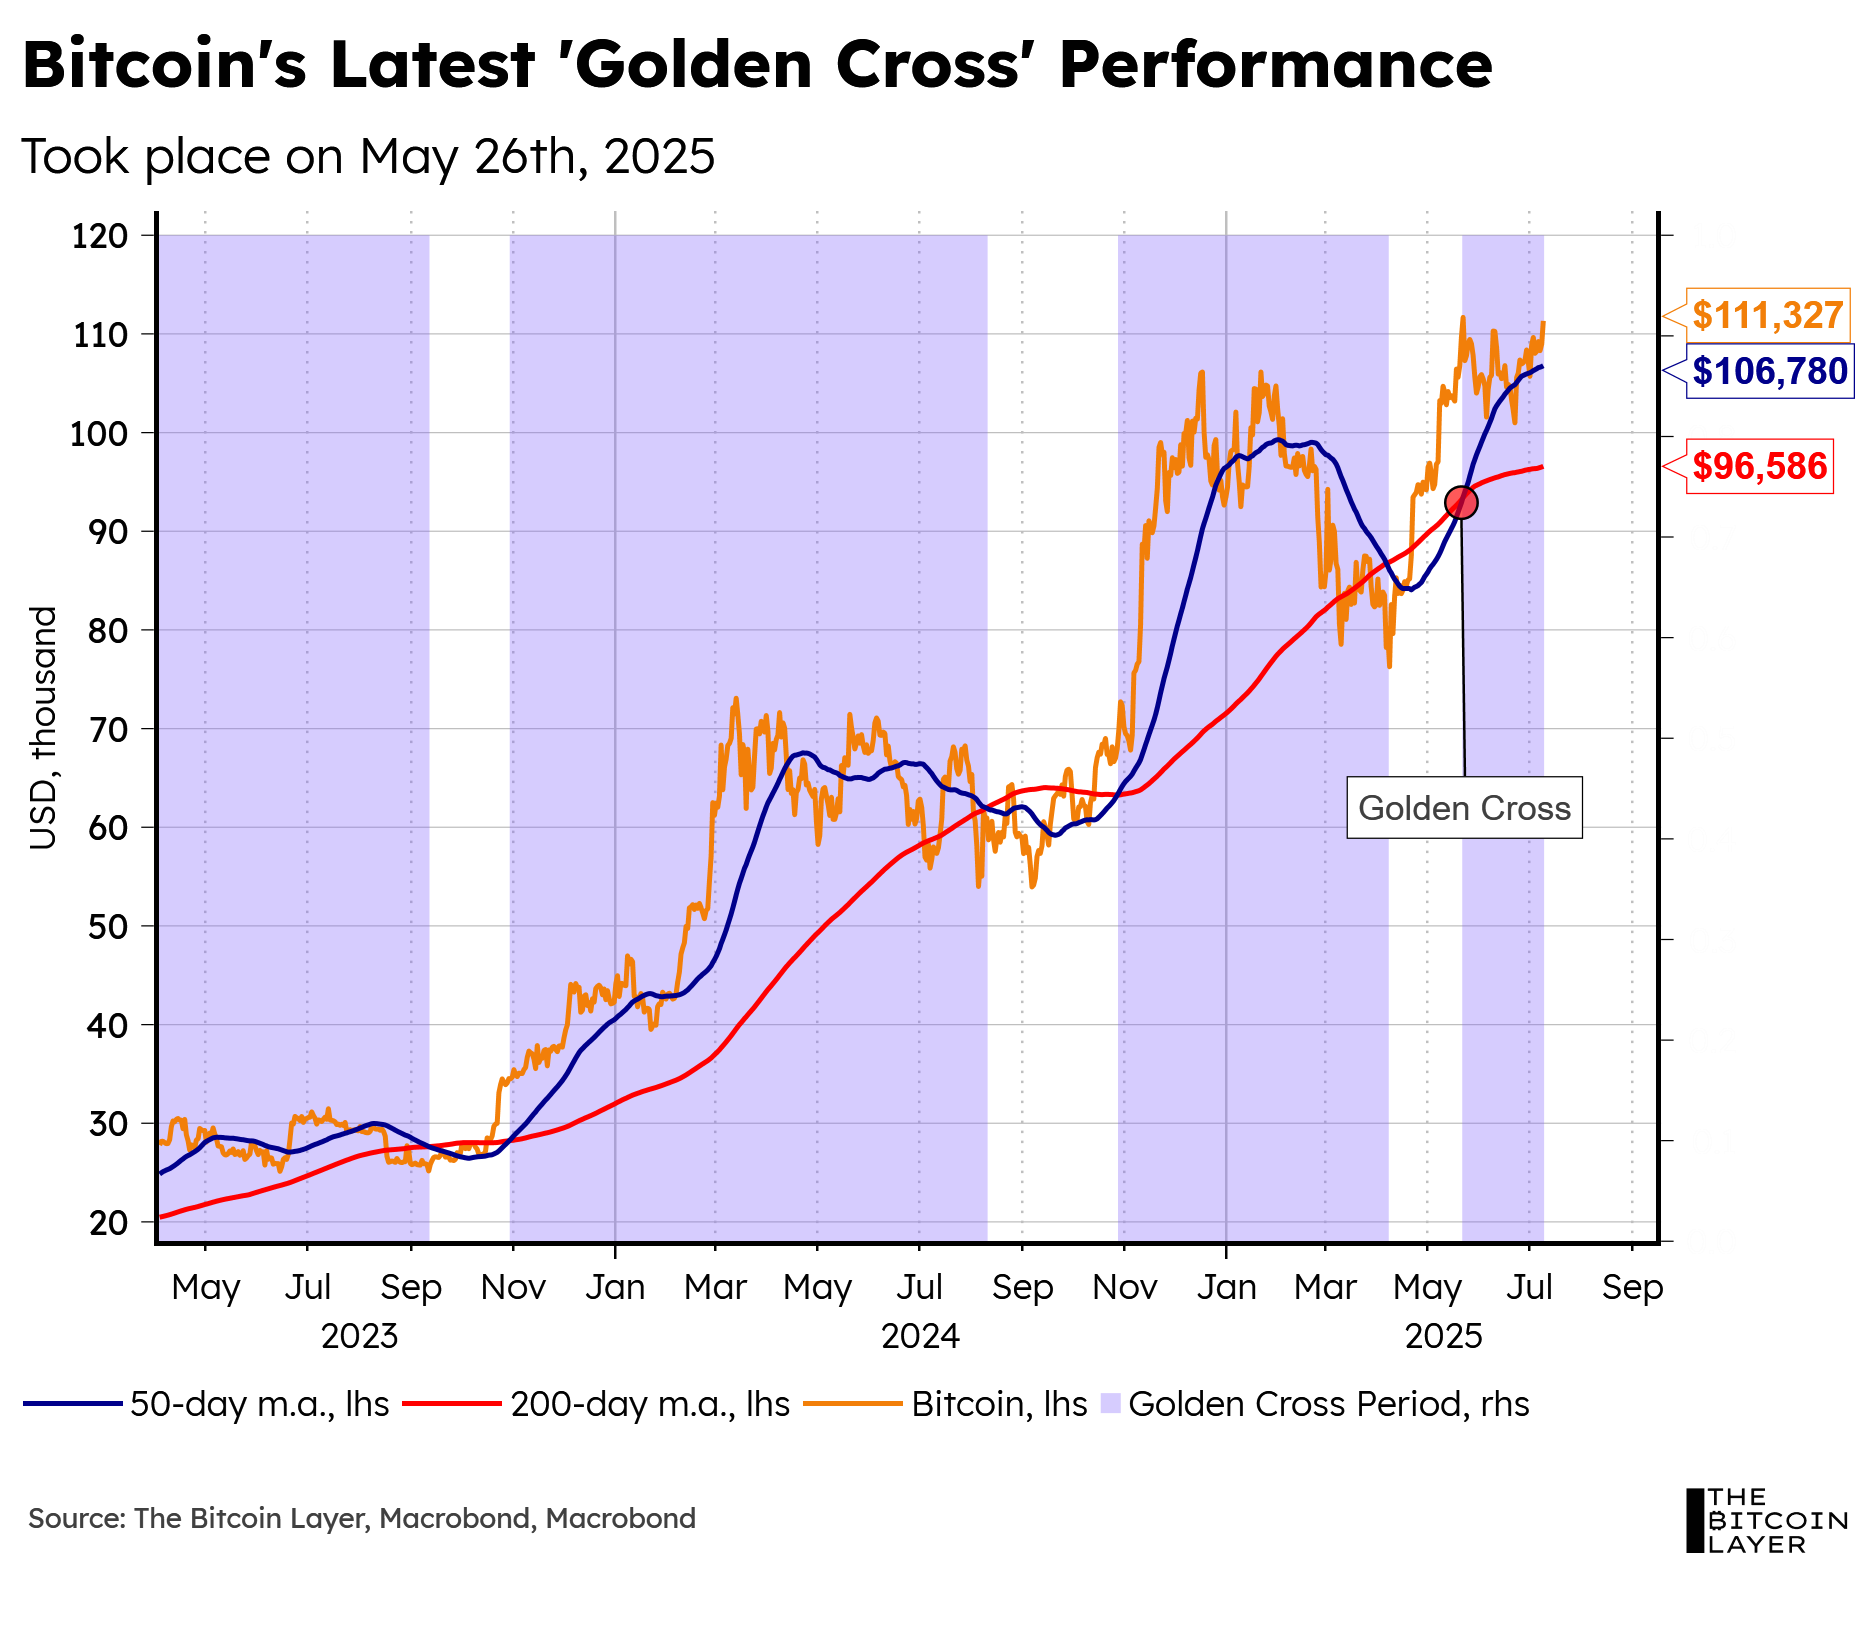
Over the past 10 years, buying under a ‘Golden Cross’ scenario has yielded positive returns 100 days later for the majority of observations, with the median observation returning approximately 27%.

Bitcoin: Technical Analysis
High Time Frame
For this risk report, we’re focusing less on price action and more on volatility or rather, the current lack of it. In previous reports, we outlined a potential upside target and highlighted key levels to watch on the downside.

Bollinger Bands, developed by John Bollinger in the 1980s, are a dynamic volatility tool that plots a 20-period simple moving average, along with upper and lower bands set two standard deviations away. Contracting bands indicate low volatility and the potential for breakouts, while expanding bands reflect heightened price swings.
What we’ve done is add a measure of the relative spread between the bands. In absolute terms, the spread is currently around $9,000, which is much higher than the $1,500 spread seen at the bottom of the bear market in January 2023. However, relative to the market price, the spread is nearly the same. Despite the large dollar value, this suggests that volatility remains low. Historically, such low-volatility periods are often followed by significant breakouts. The key question is: in which direction?
Bollinger Bands themselves don’t predict direction. However, when comparing previous periods of band compression with the Relative Strength Index (RSI), we’ve observed a consistent pattern over the last six instances: when the RSI was above its RSI-based moving average (MA), the breakout tended to be to the upside and vice versa.
Currently, the RSI is slightly above its MA, but it’s a close call, and a rejection is still possible. The longer bulls fail to break above resistance, the more likely it becomes that the price will attempt a breakout to the downside. Bulls need to step up and show conviction if they want to push the market higher.
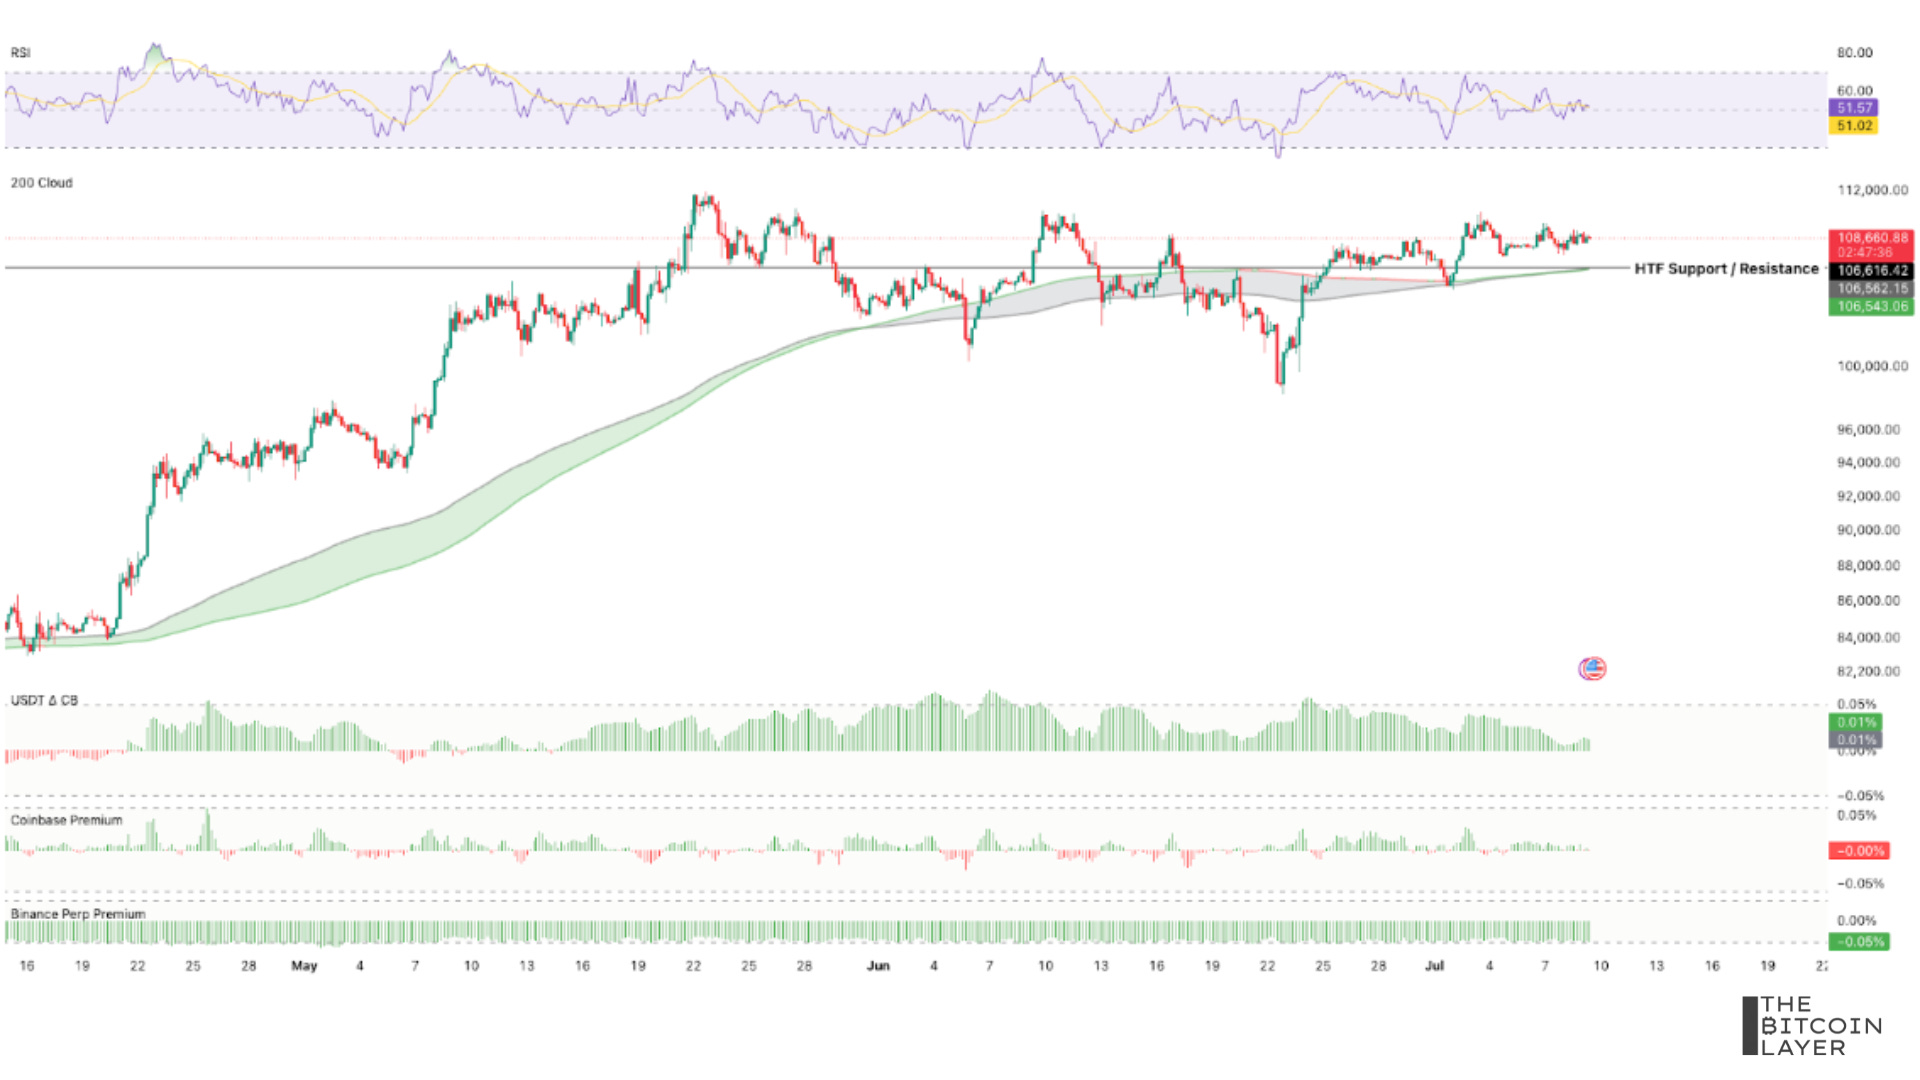
Low Time Frame
On the low time frame, there isn’t much to report. We’ve been trading in a tight range since May 20th. This marks the third time in the last four risk reports (spanning eight weeks) that we’ve noted the price hovering around ~$109,000.
One positive sign remains the USDT premium, which indicates that crypto-native liquidity continues to grow. We also keep seeing automated alerts about freshly minted USDT and USDC, suggesting ongoing capital inflows.

Several signals point to a bullish outlook, and the supply at this price level should eventually dry up. What do we mean by that? At each level, there are holders selling their bitcoin for various reasons. But over time, everyone who intended to sell at this level likely will have done so. As a result, the available supply diminishes. If demand remains steady, price should rise to establish a new equilibrium.
However, a portion of the supply comes from traders. If it takes too long for the market to push toward new all-time highs, these traders may lose confidence and start selling. This could increase supply, stall upward momentum, and potentially trigger a breakout to the downside.
TBL Liquidity
Quarterly Liquidity Cycle
The TBL Liquidity Cycle continues to show signs of strength in our overall index. The trailing 30-day change shows that TBL Liquidity continues to reach new highs every 30 days: