One (Power) Law to Rule Them All: TBL Weekly #147
Integrating Bitcoin’s Power Law Into Our Framework
Dear Readers,
Before we get started, I’d like to point out that this article will deviate from our usual style of writing. I will be writing in first person, as this gives me the freedom to take you on my learning journey.
Although I like to believe that I am quantitatively inclined, I’m a triple-bogey at best when it comes to more intense statistics and mathematics. There are people out there who can grasp mathematical concepts almost intuitively. I met many of them throughout my finance degree, and while I didn’t do too badly for myself, let’s just say they could do in 2 hours what I could do in 12. All this to say, if I can understand this stuff, I strongly believe anyone else can too.
Part of my job here at TBL is to do quantitative work, but the other part is to transform that work into palatable content that readers can grasp without falling asleep, which is arguably more difficult than the quant work itself—and something I am slowly working on perfecting, but I digress.
This post is part one of many to come, and represents our first attempt at explaining the hidden order of complexity: power laws.
Before we can integrate power laws into our TBL framework, we must first understand what power laws even are and how they present themselves in our world. So, without further ado, let’s dive into TBL Weekly #147.
A big thanks to Giovanni Santostasi’s and Stephen Perrenod’s work for inspiring today’s article.
Stop treating bitcoin like any other asset. It’s time to build a long-term strategy and declare your financial independence. Unchained’s Financial Freedom Bundle is designed to help serious bitcoin holders secure their future by taking control of their generational wealth.
Request the bundle to get:
A premium bitcoin coffee table book, Foundations
A digital copy of our 2025 hardware wallet guide
An invite to an exclusive July macro strategy session with Tuur Demeester
First 100 to request a bundle receive a physical copy of Foundations.
Blockstream Jade Plus is the easiest, most secure way to protect your Bitcoin—perfect for beginners and pros alike. With a sleek design, simple setup, and step-by-step instructions, you'll be securing your Bitcoin in minutes.
Seamlessly pair with the Blockstream app on mobile or desktop for smooth onboarding. As your stack grows, Jade Plus grows with you—unlock features like the air-gapped JadeLink Storage Device or QR Mode for cable-free transactions using the built-in camera.
Want more security? Jade Plus supports multisig wallets with apps like Blockstream, Electrum, Sparrow, and Specter.
Protect your Bitcoin, sleep better, stack harder. Use code: TBL for 10% off.
Our videos are on major podcast platforms—take us with you on the go!
Apple Podcasts Spotify Fountain
Keep up with The Bitcoin Layer by following our social media!
YouTube X LinkedIn Instagram TikTok
The area of a square
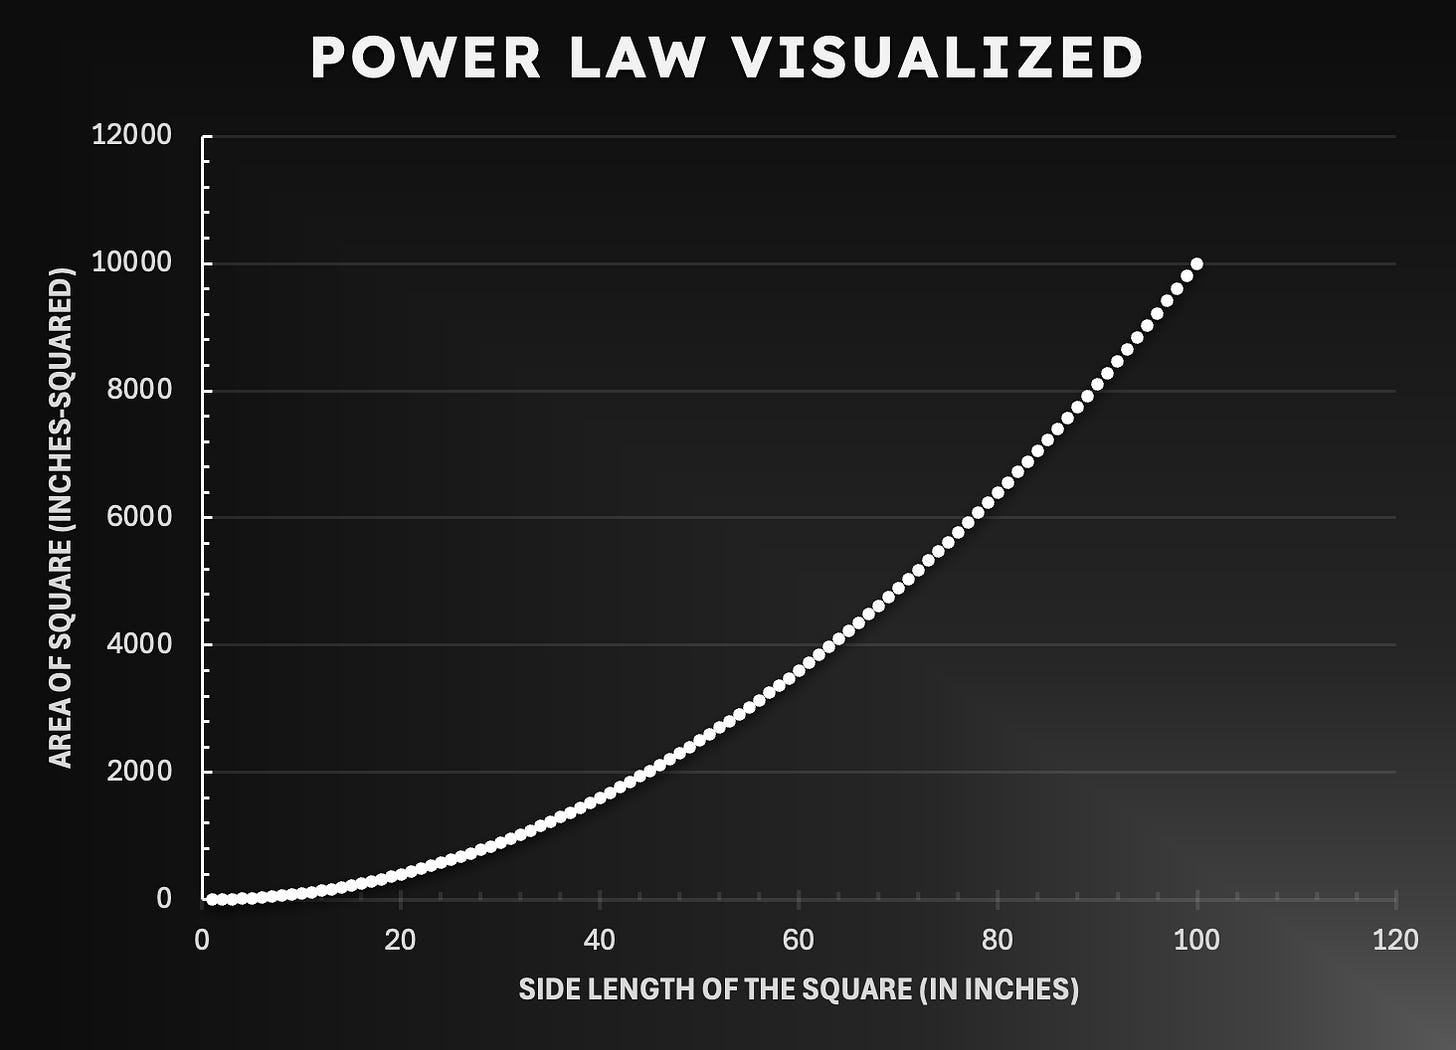
Let’s start out with a very simple, yet powerful example of the power law in action. Say you have a square with 2-inch sides. The area of this square is thus 4 square inches. If we doubled the length of the sides to 4 inches, the area would grow as follows:
Thus, the area of a square is a function of its sides, and their relationship can be expressed as such:
An easier way to see this relationship is through a chart, as it allows you to visually comprehend how the relationship plays out dynamically. When we plot the function above using linear axes, we get the following visualization:
As the length of the sides of the square increases, the area of the square grows quadratically—that is, every time the sides double, the area quadruples.
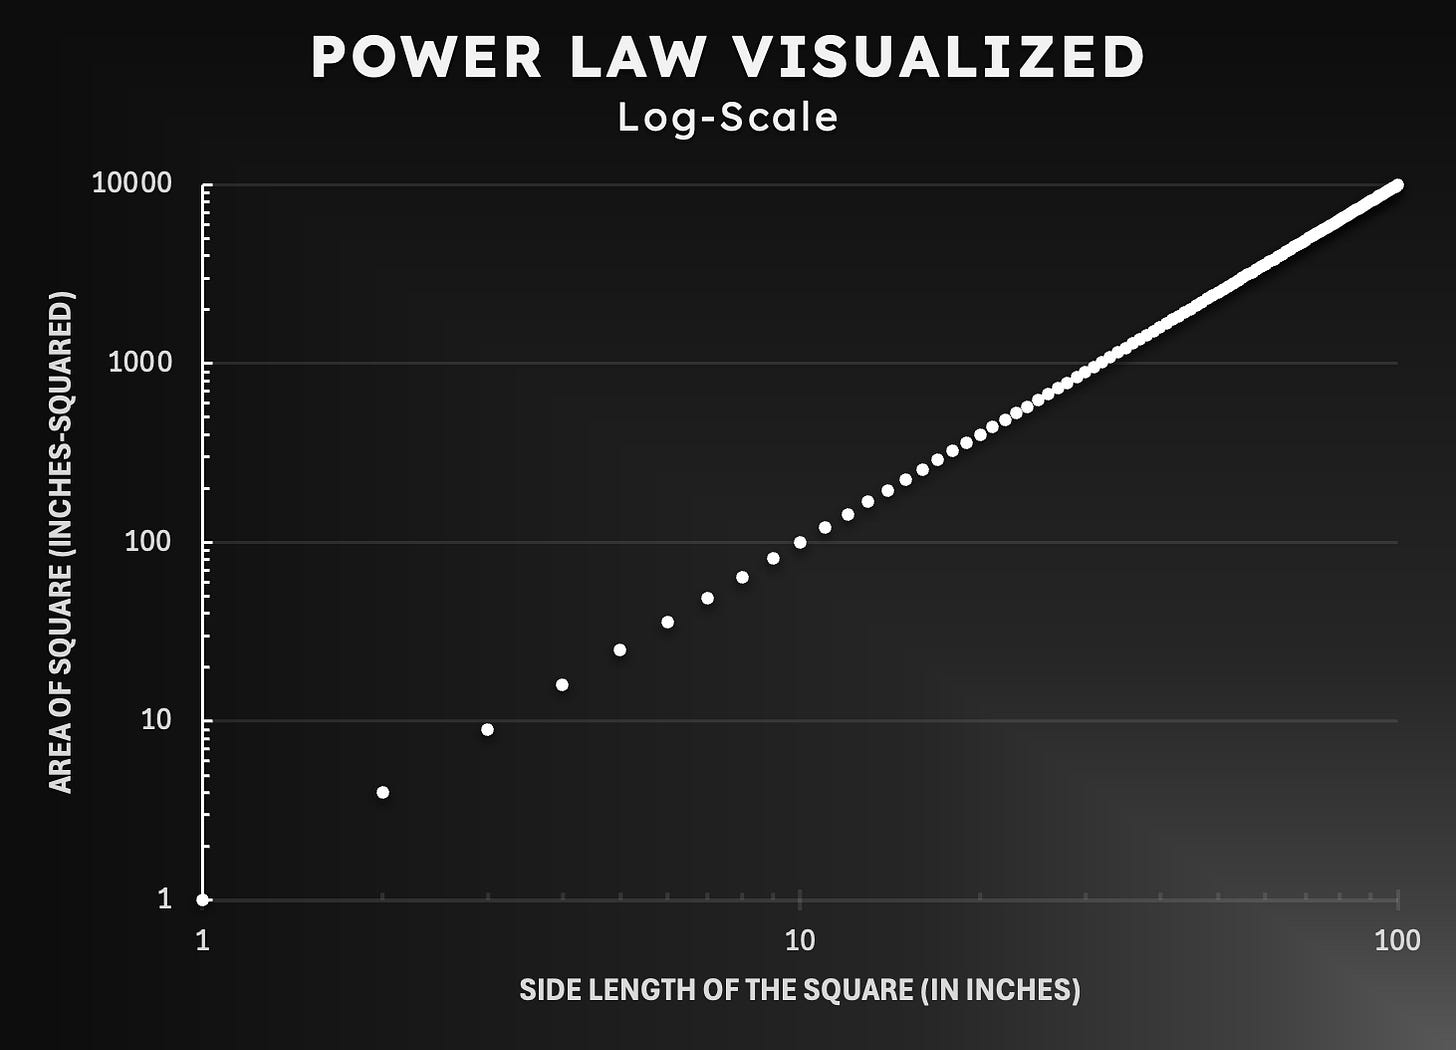
Let us now plot these same data points, but this time, using logarithmic scales on both axes:
Now, all of a sudden, these two quantities have a linear relationship, which means that the area of a square and its sides have a power law relationship.
Where else can we find the Power Law?
The Power Law can be observed across various facets of life. The easiest one for me to grasp is income distribution, which is approximated as a power law distribution. Whether we like it or not, income inequality is nearly inevitable due to mathematical principles. Statistically speaking, only a small percentage of people earn the big bucks, while the rest of us lie near the norm.
Let’s look at the following income distribution I made up:
As you can see from the chart, most people lie at the low end of the income spectrum, while only a handful of individuals earn over $500,000 per year (at least in our fake sample data). Although the illustration uses made-up numbers, real-life income distributions look fairly similar. Just think about it intuitively: it makes sense for the distribution to look like this (at least on the right side of the income distribution), as there are simply more poor people than rich people in this world.
Notice, however, that the curved pattern of the chart is similar to that of the square chart at the beginning of the article. That is, there seems to be a power law relationship. In order to verify this, let’s log-scale both axes:
Voila! This exemplified income distribution follows a power law distribution closely, as seen by the resulting straight line from the transformation above—a few bumps here and there, but the line is darn near close to perfectly straight.
One more real-life example
Geoffrey West, a distinguished theoretical physicist and practically the face one thinks of when pondering Power Laws, likes to use the example of metabolic rates as a function of body mass. Put simply, his example explains how much food a living thing needs to eat to stay alive as a function of its size. Here’s his chart:
What’s impressive about this chart, as West remarks, is that despite each of these animals growing in completely different physical environments, undergoing completely different evolutions, and having their own sets of natural complexities, they all perfectly fit into one straight line—fascinating, indeed.
In fact, the linear relationship amidst this diverse set of species is such an extraordinary regularity that it almost seems impossible…like it’s not real. If you ever saw this chart without any knowledge of power laws, you’d think that someone messed with the data, or at the very least raise an eyebrow. Something else is going on. But the simple explanation is just that: power law!
As Dr. Seuss once put it:
“Sometimes the questions are complicated and the answers are simple.”
Bitcoin, Power Law, and a certain path to $1M
Studying to write this post, I couldn’t get one question out of my head. Giovanni Santostasi put it best when he wrote:
“Power laws are mathematical expressions of the form y=A x^n and are ubiquitous in nature but also in social phenomena and many parameters related to how a city or a nation grows.”
Power laws are everywhere. But if this linear relationship is everywhere, where’s the alpha? How does a bitcoin investor benefit from plotting a chart like the one we made below (inspired by Santostasi’s work):


