PUBLIC: Stock Market, Unresolved
While the 2022 trends of rampant inflation, higher rates, and aggressive monetary policy are clearly all reversing, the stock market remains in price limbo.
Dear readers,
Price guides the narrative. As rates fall and Treasuries find a consistent bid to begin 2023, the price action can easily be described by pointing to slowing growth and inflation metrics. And as stocks fell last year, we knew the source: higher rates.
As the drama around Fed tightening fades, along with the threat of 5-8% US Treasury rates, which market has us the most curious? It was, until recently, bitcoin. But now that bitcoin has dusted off its graveyard dust for the 469th time, the highest drama now revolves around the stock market. Depending on what time of day it is, pour yourself a glass of something, and let’s assess the risk market’s nerves.
We are grateful for the support of Voltage over the past several months. Thanks to Graham, Bobby, and the whole team, we at The Bitcoin Layer have been able to expand our team, produce more content, and reach more people. Over the next few weeks, we’ll be rolling out new partners that are focused on bitcoin, just as Voltage continues to be. Stay tuned!

Readers familiar with this publication might be a smidge surprised at the contents of this chart pack. We will not be dissecting any moves in Treasuries, yield curves, or Fed policy expectations. But that isn’t the only unexpected component—I’m also going to show you some 4-hour candles. Yes, you heard me correctly. We are zooming all the way in today.
Weekly
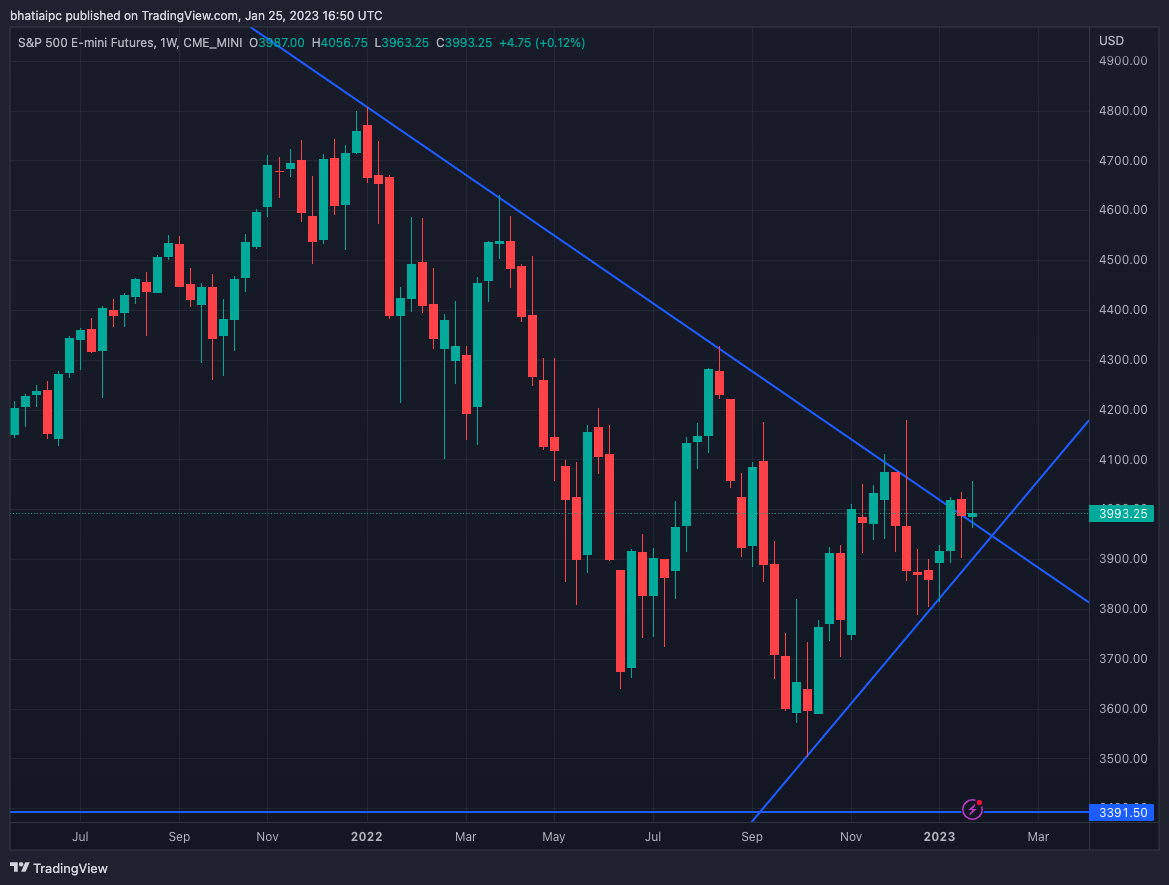
The weekly chart clearly demonstrates the falling trendline of resistance in effect since the start of 2022:
We see four consecutive lower highs (if this week’s candle is to be included), and a notable rejection of breaking out at the end of last year.
We also can see a support trendline starting to develop connecting the October lows with some higher, albeit mildly, December lows. The combination of falling resistance and increasing support results in a wedge—the way to think about wedges is that buyers and sellers, on the aggregate, are undecided on the direction of the market. Said otherwise, no trend prevails.
To dissect the price action around resistance more closely, let’s turn to the daily chart.
Daily
Looking at daily candles, the battle around this wedge, as well as the round number of 4,000, continues to be fought by the bulls and the bears. Behaviorally, there are those that believe the stock market will underperform in a recession—they are selling rallies. There are also those that believe the Fed’s hiking cycle being over is all the net liquidity needed to justify a long position—they are buying dips:
Now, let’s turn our focus to the price action on December 13th—this is the green candle you see attempting to break out of this year-long downtrend and failing spectacularly, only to be confirmed by four large down days and a burial of hopes of a breakout. The stock market held higher lows in December, and now we are yet again testing this resistance and 4,000 at the same time. Even today, we can see a protracted battle around these two behavioral magnets. This, in my humble opinion, warrants a break of tradition to look at the stock market’s price action on a more intraday basis here in the early weeks of 2023.
4-hour
You can now see the wild December 13th price action, failed breakout, and subsequent selloff more pronounced—you can also see the battle we’ve had around 4,000 this week, including all-but-perfect kisses of the trendline:
Not to sound overly excited, but this is about as dramatic as it gets in markets, especially at potential shifts in the business cycle and monetary policy cycle. The reason that drama is so heightened around stocks, and stocks only, is that the arguments about higher rates or a bitcoin funeral seem to be over. Debates rage on about recessions, soft and hard landings, and if the Fed is likely to cut rates by the end of 2023, but what seems to be driving the most disagreement is the path of stocks given the broad global economic slowdown. With bitcoin attached at the hip to stocks from a correlation perspective, both intraday and more intermediate term, the stock market’s direction matters for bitcoin in the short term. We do expect brief correlation breakdowns, but that is not our base case in a bear market (we conducted a study last year that showed bitcoin/equities correlation drops during bitcoin’s periods of high outperformance relative to stocks).
Make sure to always compare your narratives to prices. This can be dangerous, because in the short term, market prices can be very wrong. But over the more intermediate term, we have to take trends and trend reversals seriously, and then attempt to assign a story to the price movement that reflects our current reality.
If stocks break lower, it could mean we are in for inflation that refuses to go away, a Fed that doesn’t want to roll over, and a recession that might resemble 2008-2009. If they break higher, it means that at least some of those narratives are untrue—and potentially the trio.
The only drama left in financial markets is now with the S&P 500. With only a corner of one eye, we will watch the Fed jawbone markets on February 1st. With the rest of our senses, spoos (S&P 500 slang) are center stage.
Until next time,
Nik


