

Revisiting the Yield Curve’s Recession Signal - A Master Class: TBL Weekly #140

Dear Readers,
In late 2022, the yield curve began its path toward its deepest inversion in over 40 years, getting as low as -1.89 percentage points in the spring of 2023.

Historically speaking, an inverted yield curve has signalled economic peaks, which means that it is almost always followed by a peak-to-trough path (read recessions).
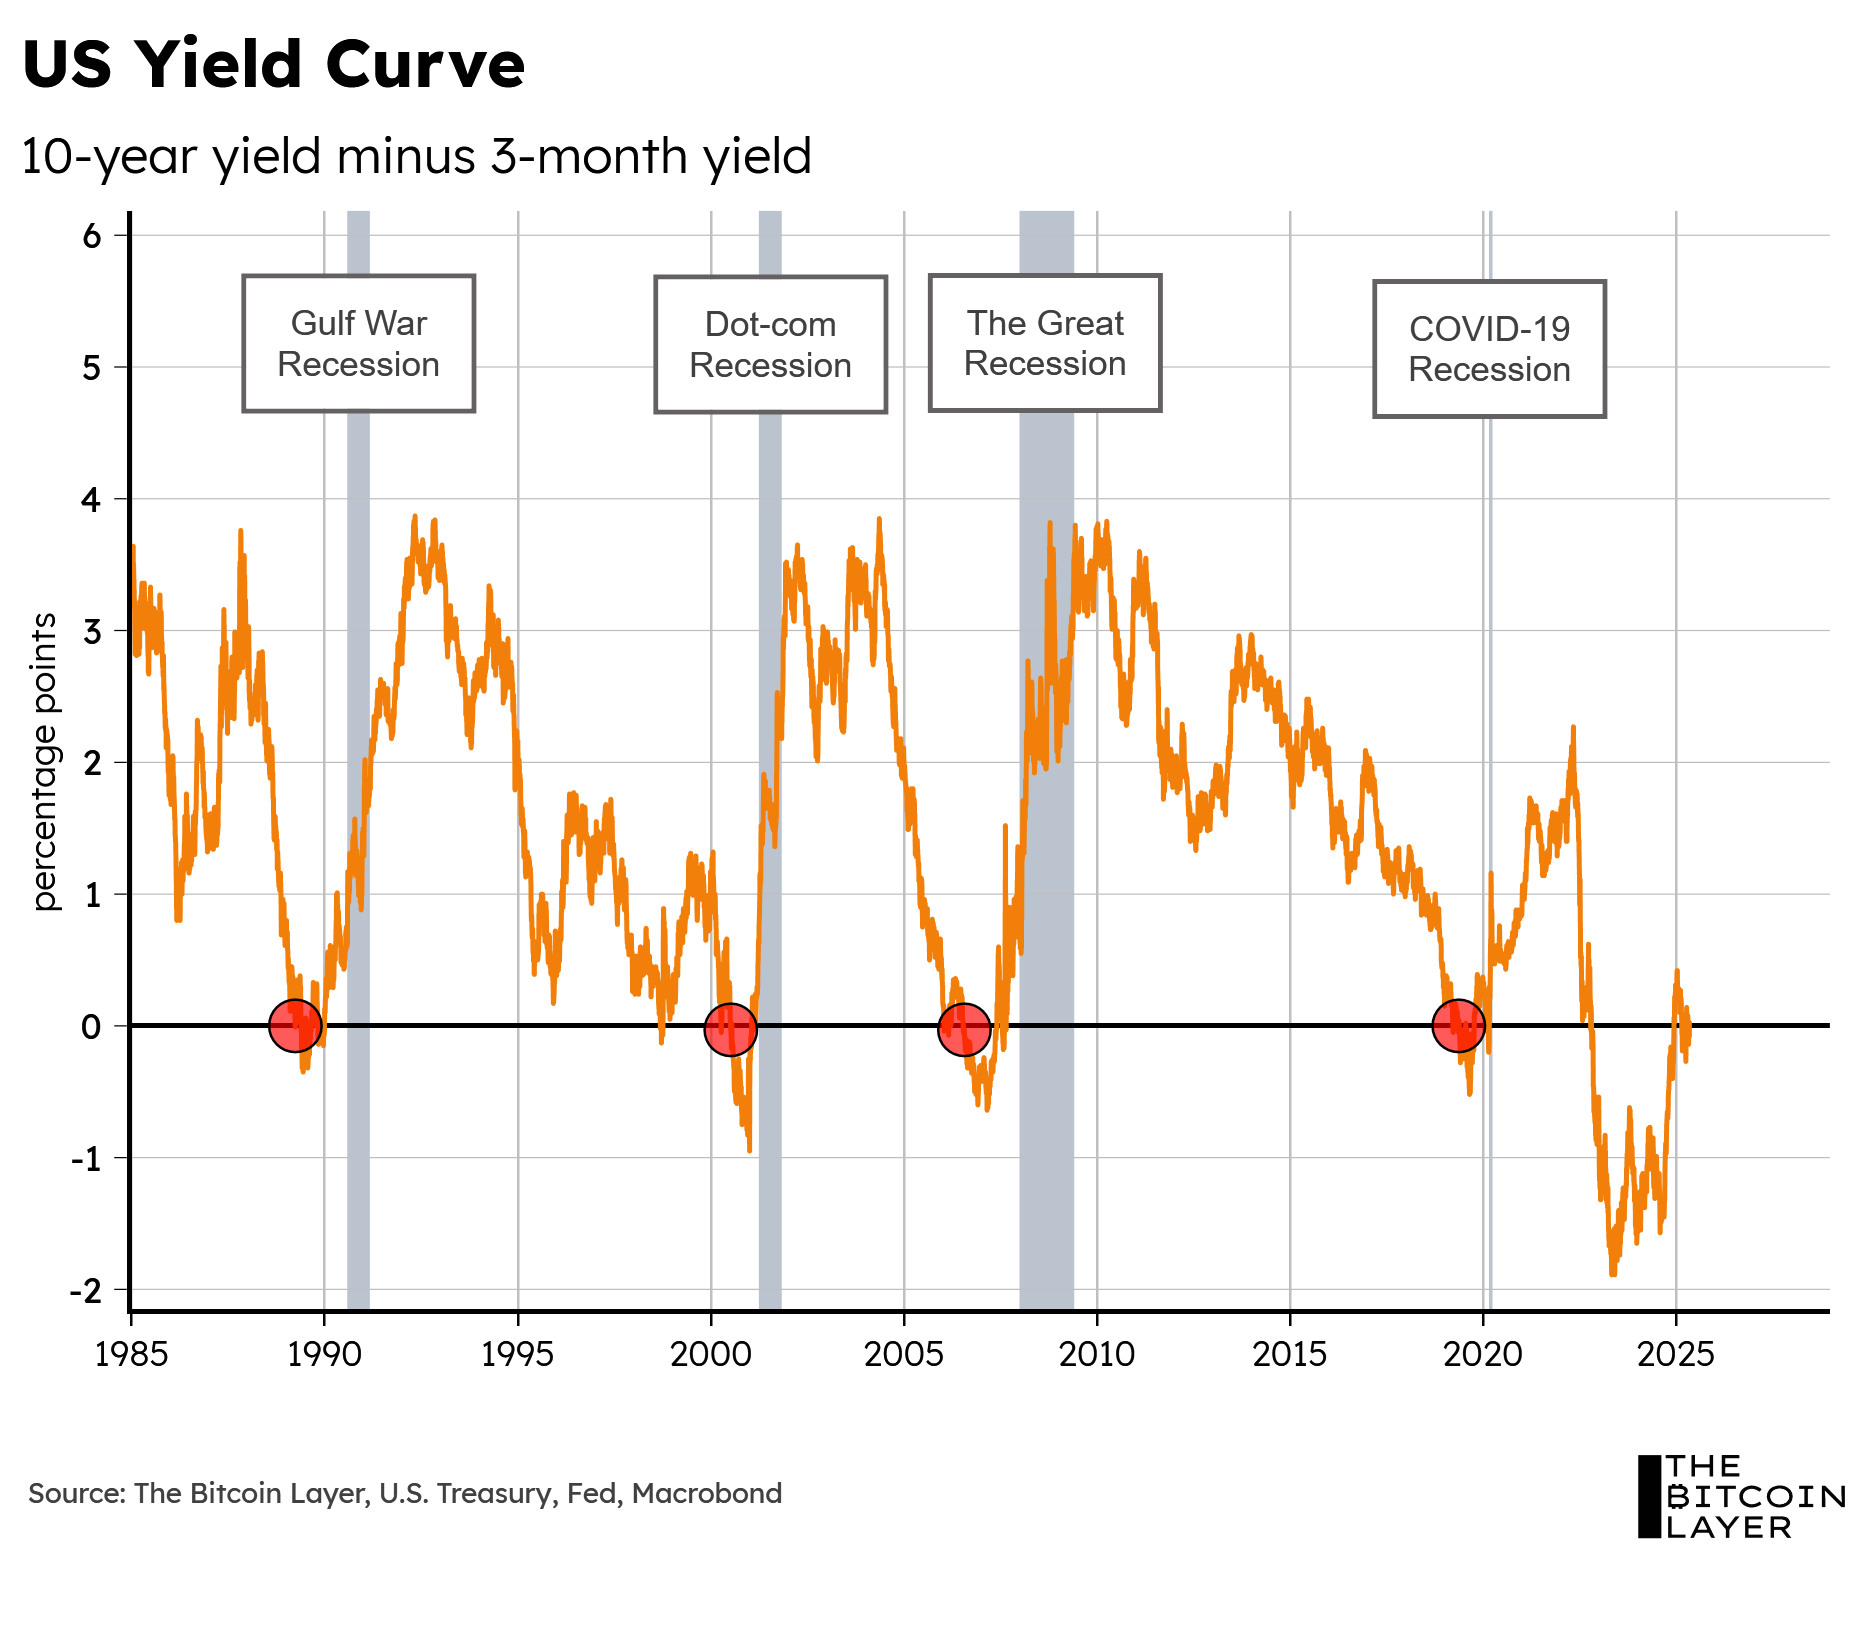
This infamous indicator is one of the main reasons we believe investors across the globe have been calling for a recession since 2022—TBL included at various points. The deep inversion has had investors on edge, looking at every hard and soft economic print for signs of validation, but the validation never arrived—or it did, but not in the way people expected (more on this later).
As noted last week, the latest GDP print showed signs of economic resilience in the US; add this to an unemployment rate remaining near all-time lows:

As well as a US services sector continuing to show signs of expansion:

And you get a very confused investor base.
So, what is going on here? What ever happened to this tried-and-tested recession indicator, and why hasn’t it worked this time around?
Well, to explain that, today’s article requires a bit of a master class in yield curve dynamics. This article is separated into five sections:
Part I: Expectations Theory
Part II: The Shape of the Curve
Part III: Why the Yield Curve’s Predictive Power Has Faded
Part IV: Inflation Expectations
Part V: Why This Latest Inversion Has Not Resulted In A Recession
So, without further ado, let’s dive into TBL Weekly #140. A big thanks to Ed Yardeni for his inspirational content that founded the theory and research for this post.

Every Business Will Buy Bitcoin
Bitcoin isn’t just for the balance sheet anymore—it’s the benchmark.
On Wednesday, May 14, at 11 AM CT, join Unchained, Strive, and other bitcoin-native thinkers for a live online event exploring how bitcoin is reshaping capital allocation. Learn why more companies are building bitcoin treasuries—and why those who don’t risk falling behind.
Our videos are on major podcast platforms—take us with you on the go!
Apple Podcasts Spotify Fountain
Keep up with The Bitcoin Layer by following our social media!
YouTube X LinkedIn Instagram TikTok

Blockstream Jade Plus is the easiest, most secure way to protect your Bitcoin—perfect for beginners and pros alike. With a sleek design, simple setup, and step-by-step instructions, you'll be securing your Bitcoin in minutes.
Seamlessly pair with the Blockstream Green app on mobile or desktop for smooth onboarding. As your stack grows, Jade Plus grows with you—unlock features like the air-gapped JadeLink Storage Device or QR Mode for cable-free transactions using the built-in camera.
Want more security? Jade Plus supports multisig wallets with apps like Blockstream Green, Electrum, Sparrow, and Specter.
Protect your Bitcoin, sleep better, stack harder. Use code: TBL for 10% off.
Weekly Analysis
Part I: Expectations Theory
A yield curve approach that we at TBL find extremely useful and intuitive is the theory that yields across the curve represent expectations of short-term interest rates over time. Let us use an example to explain this concept:
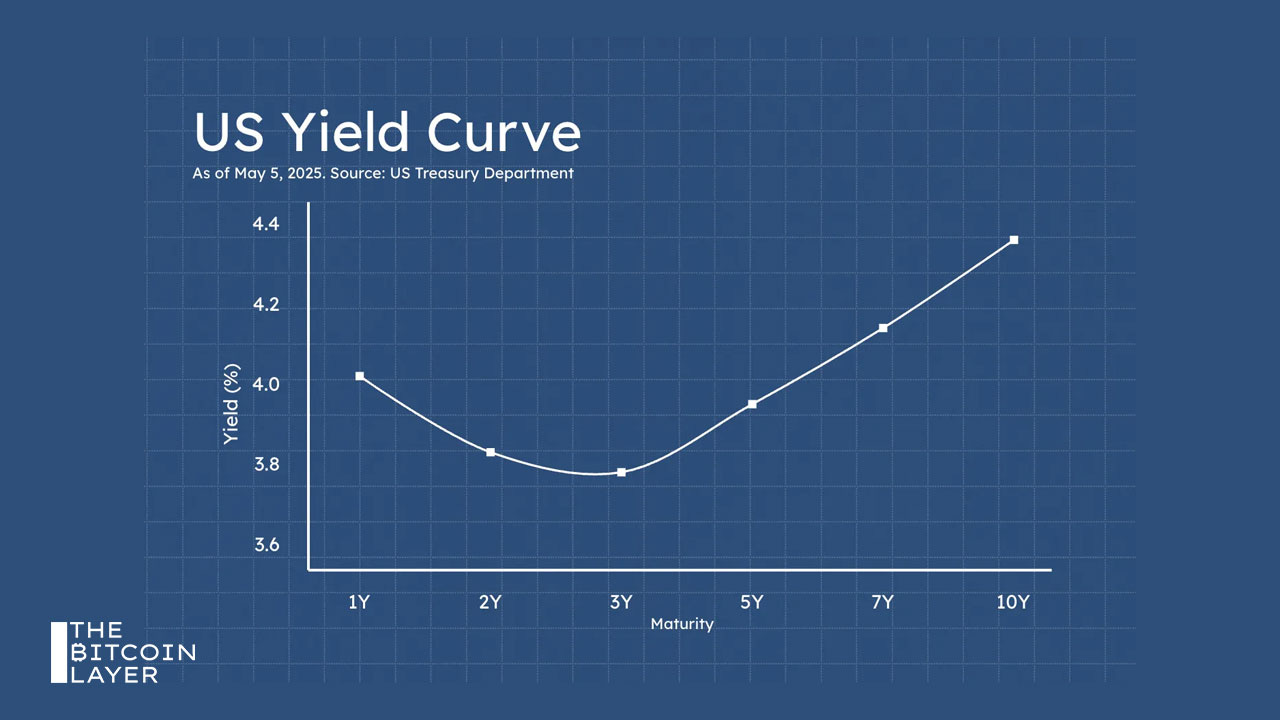
Say the Fed was able to credibly convince investors that it is going to hold interest rates steady at 4% over the next 10 years.
If the 10-year yield represents expectations of the 1-year yield over the next 9 years, then such an announcement would anchor the entire curve at the 4% handle (see Figure 1 below).

In short, the yield curve would flatten with less uncertainty about the future outlook of short-term interest rates.
This example is not too far from what happens in reality. In fact, in 2011, the Fed announced that it would likely keep the Fed Funds Rate at exceptionally low levels at least through mid-2013.
This forward guidance created certainty across the Treasury market, leading to a major flattening of the yield curve via a bid on 10-year Treasuries:

This leads us to the next important part of the yield curve: its shape.
Part II: The Slope of the Curve
Using our theory of expectations, an ascending yield curve necessarily means that investors expect short-term interest rates to increase over time, perhaps due to an economic expansion currently underway, which leads to market expectations that the Fed will soon increase interest rates to slow down accompanying inflationary pressures. Accordingly, investors demand higher rates for tying their money up for longer periods and being exposed to this interest rate risk.
Next, as explained in our earlier example, a flat yield curve means investors expect short-term rates to remain stable over time.
And last but not least, an inverted yield curve, or a downward sloping curve…