River is our Bitcoin exchange of choice.
Securely buy Bitcoin with zero fees on recurring orders, have peace of mind thanks to their 1:1 multisig cold storage custody, and withdraw at any time. Need help? They have US-based phone support for all clients.
Now introducing River Link 🔗allowing you to send Bitcoin over a text message that can be claimed to any wallet. Give a gift, pay a friend for dinner, or orange pill your friends, completely hassle-free.
Use River.com/TBL to get up to $100 when you sign up and buy Bitcoin.
When the dust clears after an extremely eventful week like the last, one in which several months’ worth of progress for bitcoin was jammed into Thursday and Friday alone, we like to take a step back and regain our bearings.
Today, we’re taking a look at liquidity, derivatives, volatility, and the GBTC fee arbitrage trade to get an accurate lay of the land as we head into the halving just three short months from now. We also end with a stern warning.
Liquidity
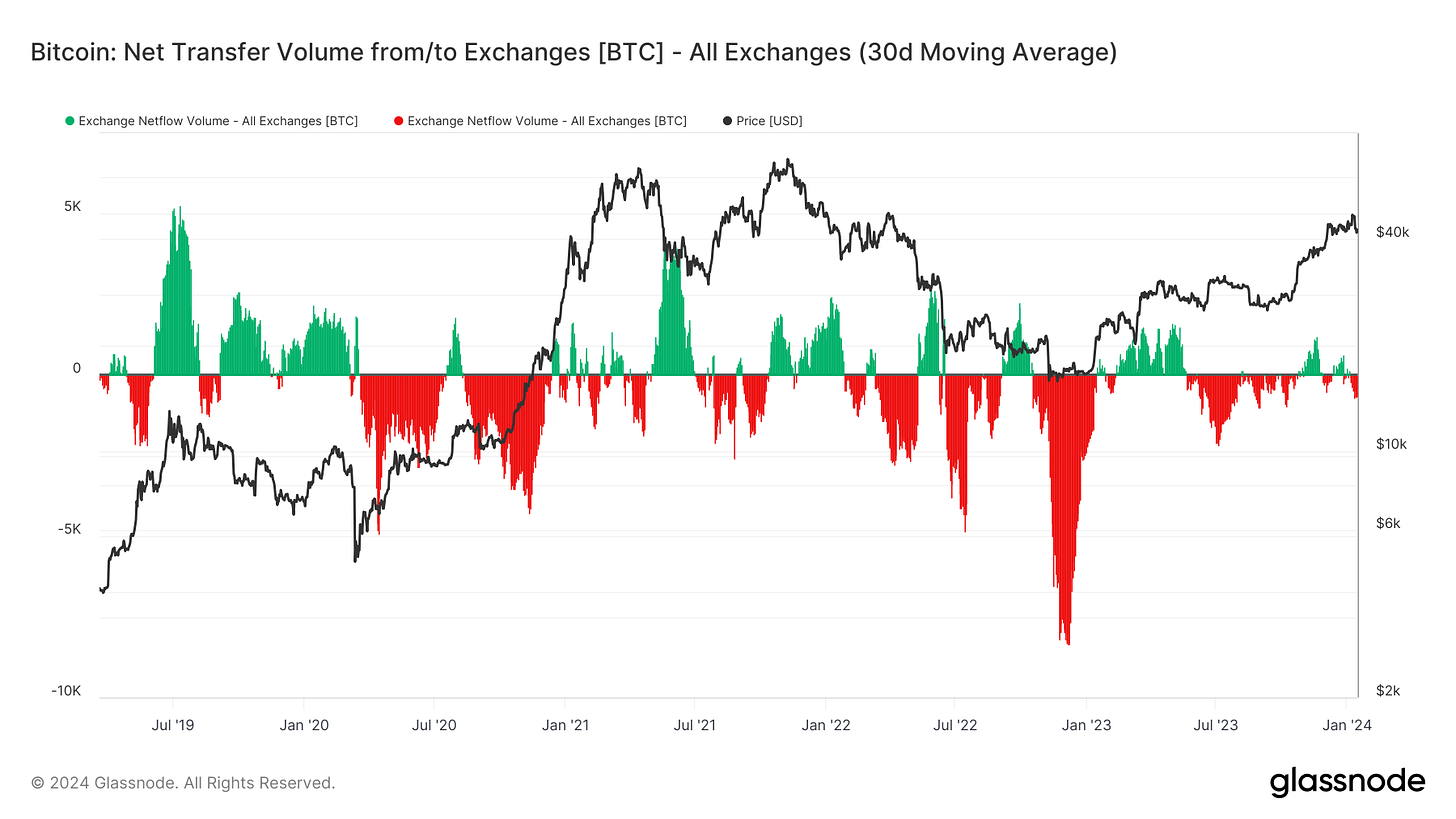
Net transfer volume to and from exchanges over the last 30 days is tame, especially compared to when bitcoin’s price was last at these levels:
Zooming in further, you’ll note that inflows and outflows since October have basically canceled themselves out, as opposed to the extreme outflows and inflows that dominated the last cycle’s run-up to its all-time high:
If coins aren’t flowing to or from exchanges in a very pronounced way, what are they doing? Sitting still.
The percentage of supply last active at least 1 year ago is at 70.3% which is an all-time high compared to the level reached in previous cycles—see the red line below. Zooming in further to more dormant cohorts, supply last active 2 or more years ago is at 57.2%, last active 3+ years ago is at 44%, and last active 5+ years ago is 31.7%. Every age cohort for dormancy bitcoin is growing as a percentage of outstanding supply:


