

TBL Liquidity Indicator: TBL Weekly #158

Dear Readers,
This post will be dedicated to our latest improvements in our TBL Liquidity Indicator. We’ve received many questions about the signal derived from our TBL Liquidity Cycle, specifically about how you can use it for your own investment decisions.
This week, we are finally able to provide you with some concrete answers, but to do so, we must walk you through the process of turning our TBL Liquidity Index into what we are now coining our proprietary TBL Liquidity Indicator™.

This article is brought to you by:

This extended $75k–$110k range has caused some to wonder if the bull run is exhausted. But what if the on-chain evidence tells a totally different story? Join James Check (Checkmate of Checkonchain) and Connor Dolan for a data-driven discussion on what a maturing bitcoin market means for the road ahead. James will break down:
Institutions reshaping the cycle: ETF flows and institutional allocator demand setting higher floors
Chopsolidation: why time-pain in the $75k–$110k range signals resilience, not exhaustion
Conviction on display: heavy distributions absorbed while long-term holders remain in control
On-chain metrics show bitcoin has crossed the Rubicon—from a nascent store of value into a true institutional-grade asset class. This session will help you understand what that means for this bull market and beyond—and how you might position yourself appropriately.
Tuesday, September 30th at 3PM CT — online, free to attend.
Register now for early access to a new on-chain metrics report from Unchained and Checkonchain:

We are also happy to announce our newest sponsor this month: Arch Lending!
At TBL, we help you decode Bitcoin’s macro trends and give clear market signals—holding Bitcoin is just the beginning. Arch lets you borrow against your Bitcoin—unlock cash without selling:
Instantly access a Bitcoin-backed line of credit
Borrow from just $5k for up to 2 years
No rehypothecation. Ever.
Insured custody at Anchorage Digital
Stay long, stay liquid.
Use code “Nik” for 0.5% off interest rate for 2 years.

Blockstream Jade Plus is the easiest, most secure way to protect your Bitcoin—perfect for beginners and pros alike. With a sleek design, simple setup, and step-by-step instructions, you’ll be securing your Bitcoin in minutes.
Seamlessly pair with the Blockstream app on mobile or desktop for smooth onboarding. As your stack grows, Jade Plus grows with you—unlock features like the air-gapped JadeLink Storage Device or QR Mode for cable-free transactions using the built-in camera.
Want more security? Jade Plus supports multisig wallets with apps like Blockstream, Electrum, Sparrow, and Specter.
Protect your Bitcoin, sleep better, stack harder. Use code: TBL for 10% off.
Our videos are on major podcast platforms—take us with you on the go!
Apple Podcasts Spotify Fountain
Keep up with The Bitcoin Layer by following our social media!
YouTube X LinkedIn Instagram TikTok
The first step: TBL Liquidity Index
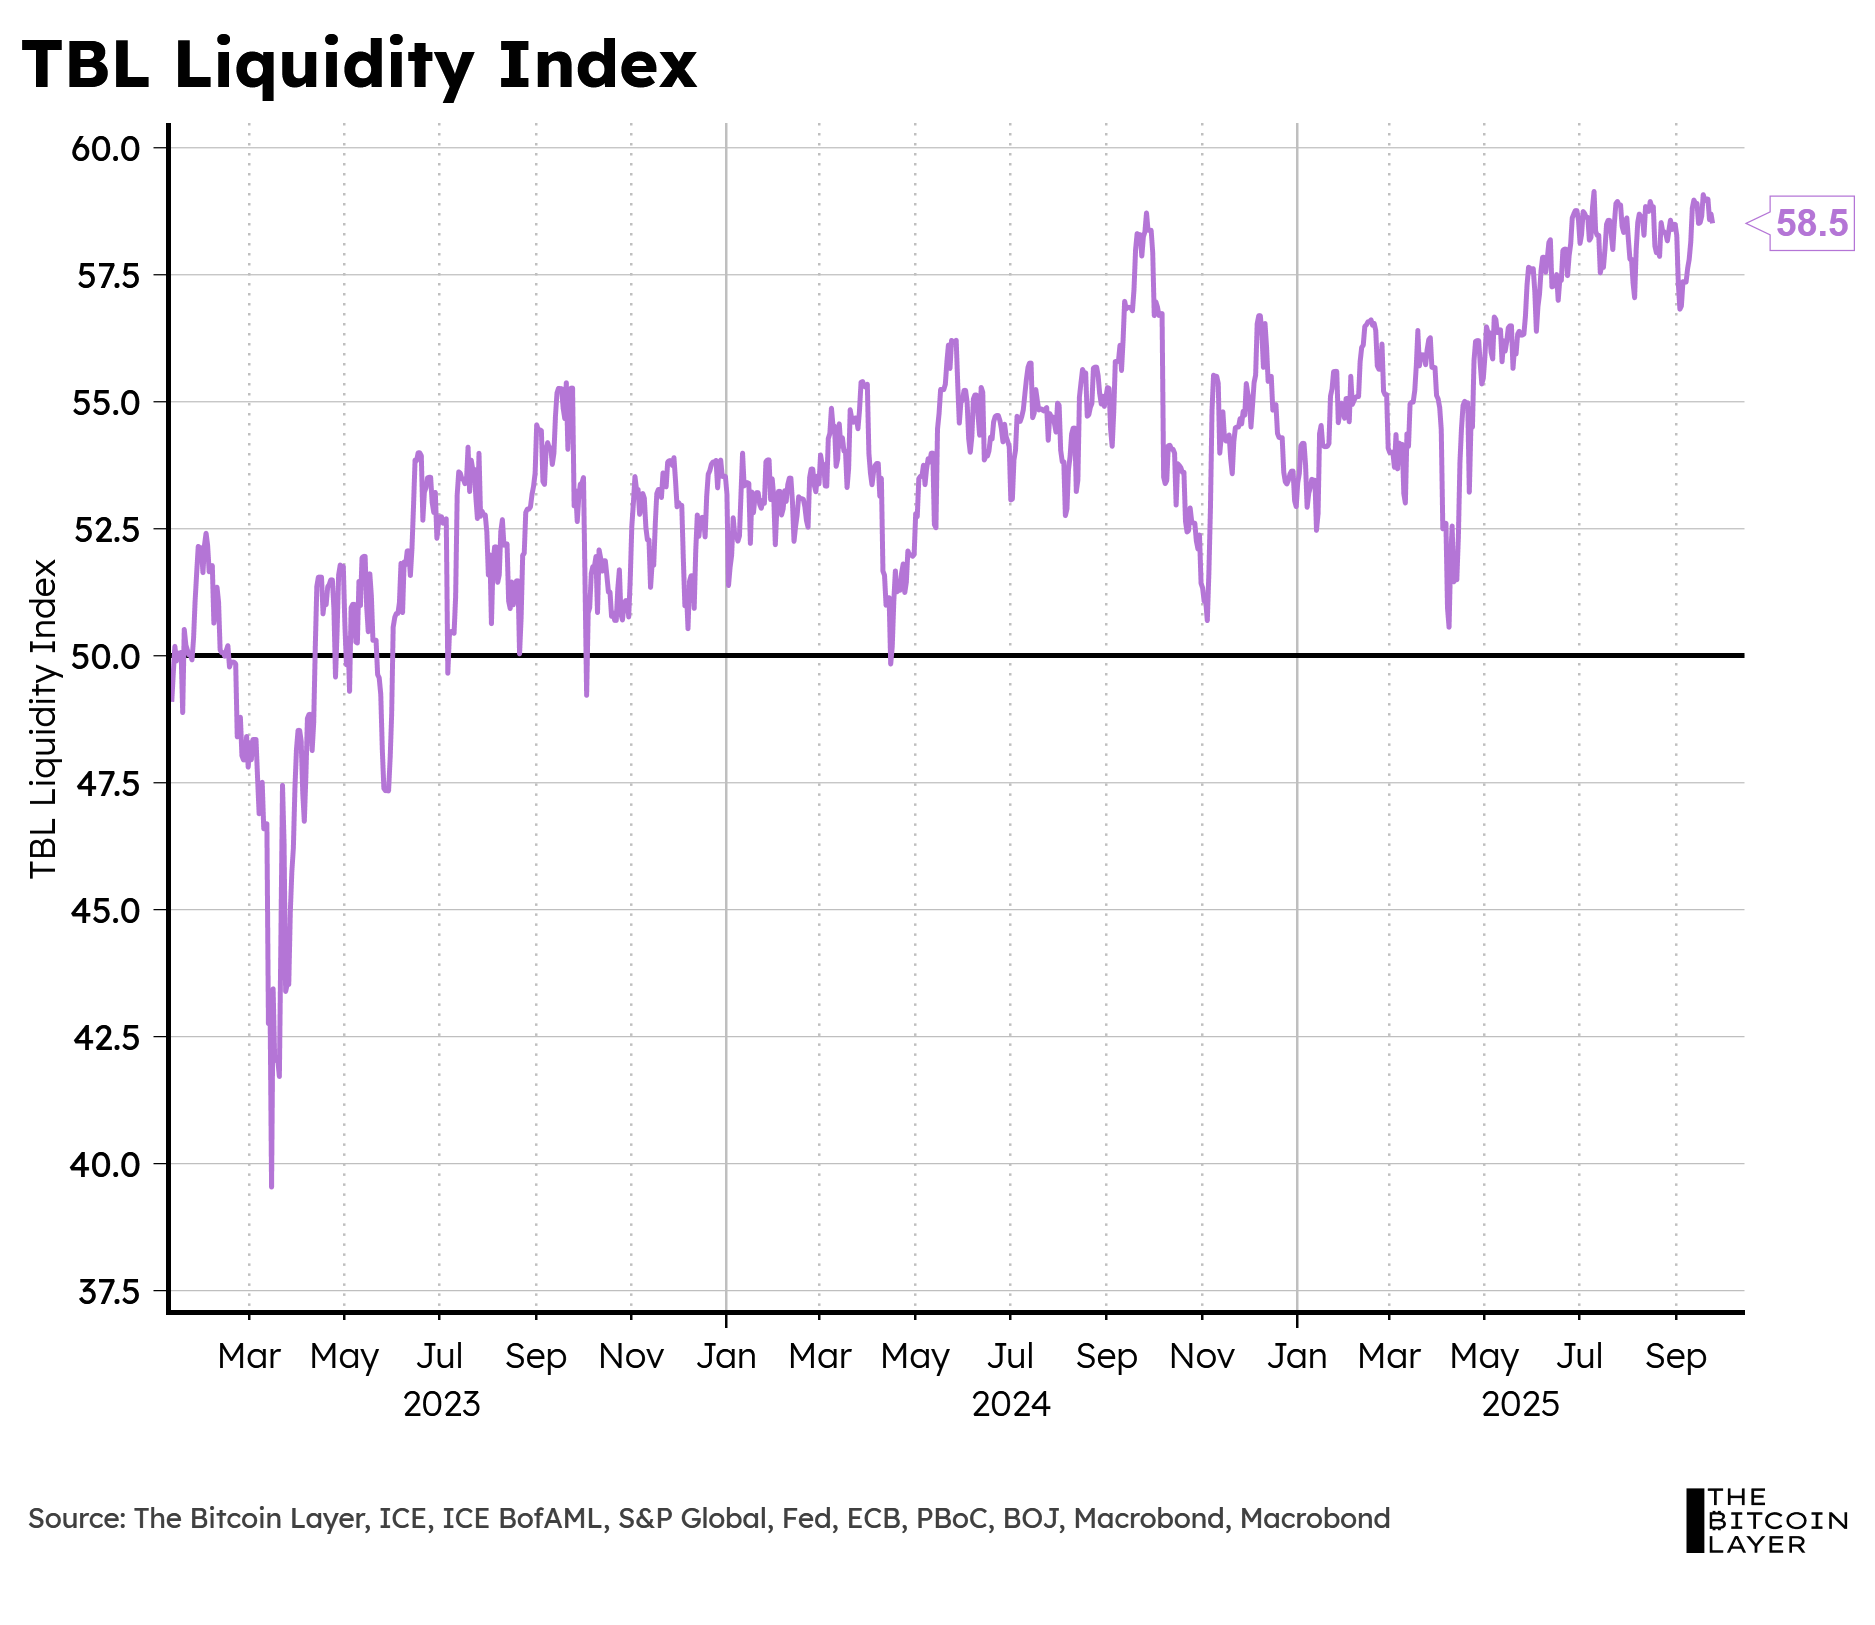
Our TBL Liquidity Index is a way for us to measure liquidity conditions within the financial system using four key components:
US Treasuries
Bond volatility
US dollar
Banking assets
We threw these four components into a quantitative blender and poured out a delicious milkshake that works as a guide for liquidity-conducive environments. A TBL Liquidity Index above 50 is tightly correlated with expansionary times, while an index below 50 matches contractionary periods.
Although our TBL Liquidity Index works as a gauge for current financial conditions, we were missing something more actionable. In other words, even if liquidity within the system is high, that doesn’t really tell us much about where to place ourselves today—missing the trees for the forest, so to speak.
So, we threw our index back into our quantitative blender…
Step 2: TBL Liquidity Cycle
When Johan joined the team, we noticed his use of nominal changes in his quantitative on-chain analyses, and used that as inspiration to mess around with our TBL Liquidity Index.
After playing with multiple nominal changes, we landed on what we have now coined the TBL Liquidity Cycle, which is just the 30-day nominal change of our TBL Liquidity Index:
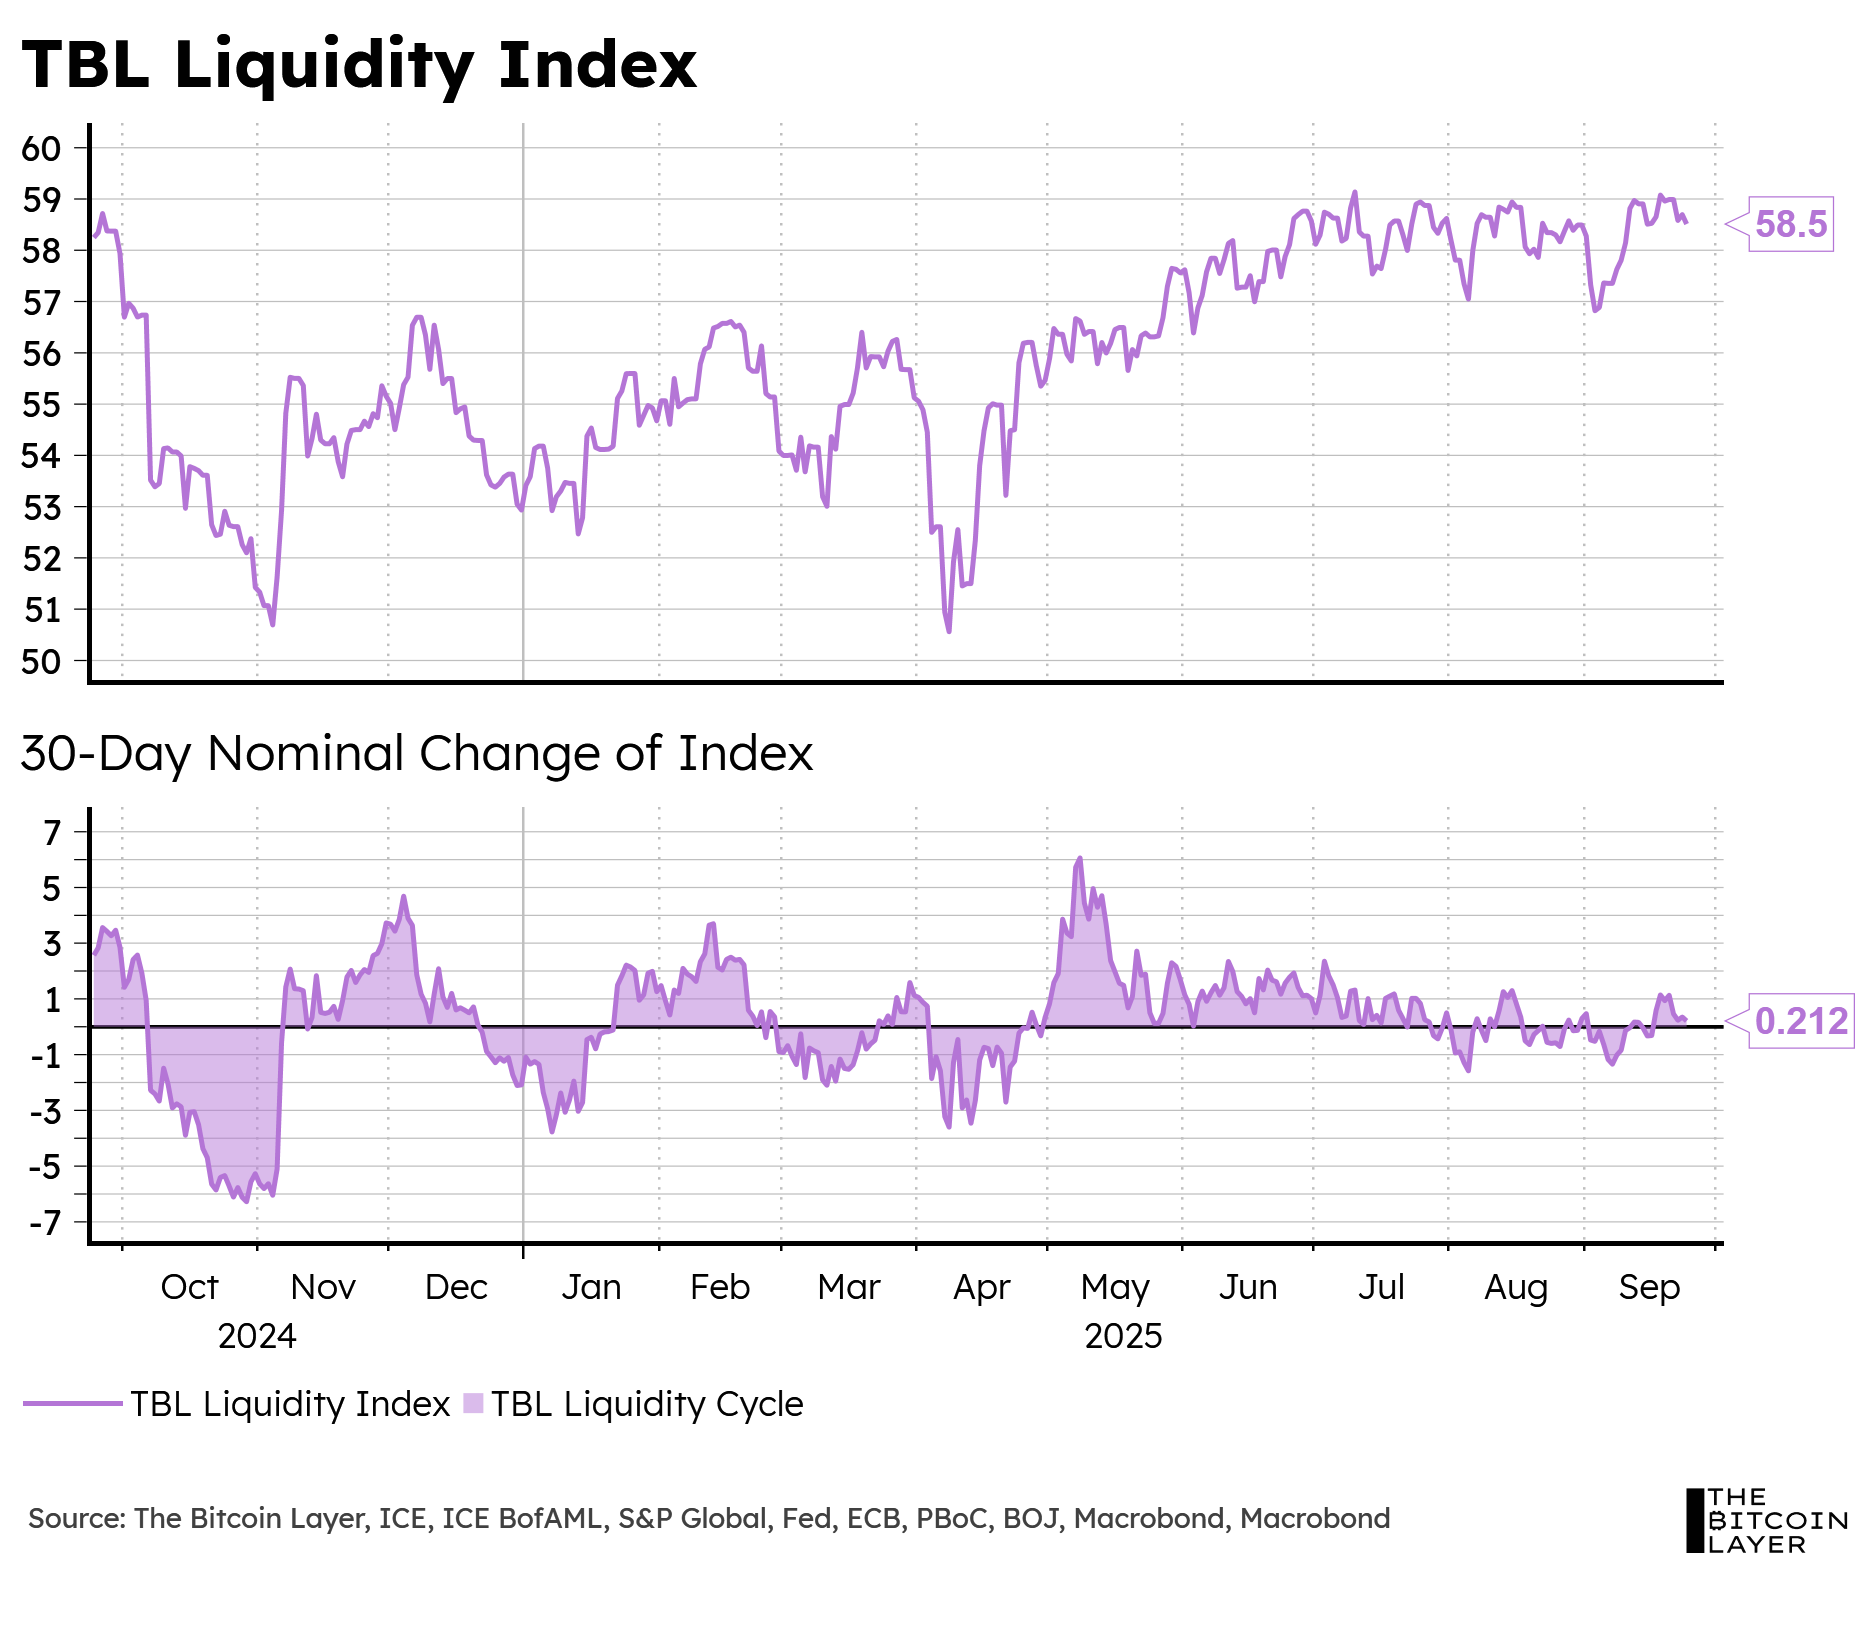
The theory behind this transformation was to identify shorter-term cycles within the overall financial liquidity trend, and by doing so, one could ride short-term liquidity waves by buying liquidity-responsive assets (i.e., risk assets such as bitcoin and the S&P 500).
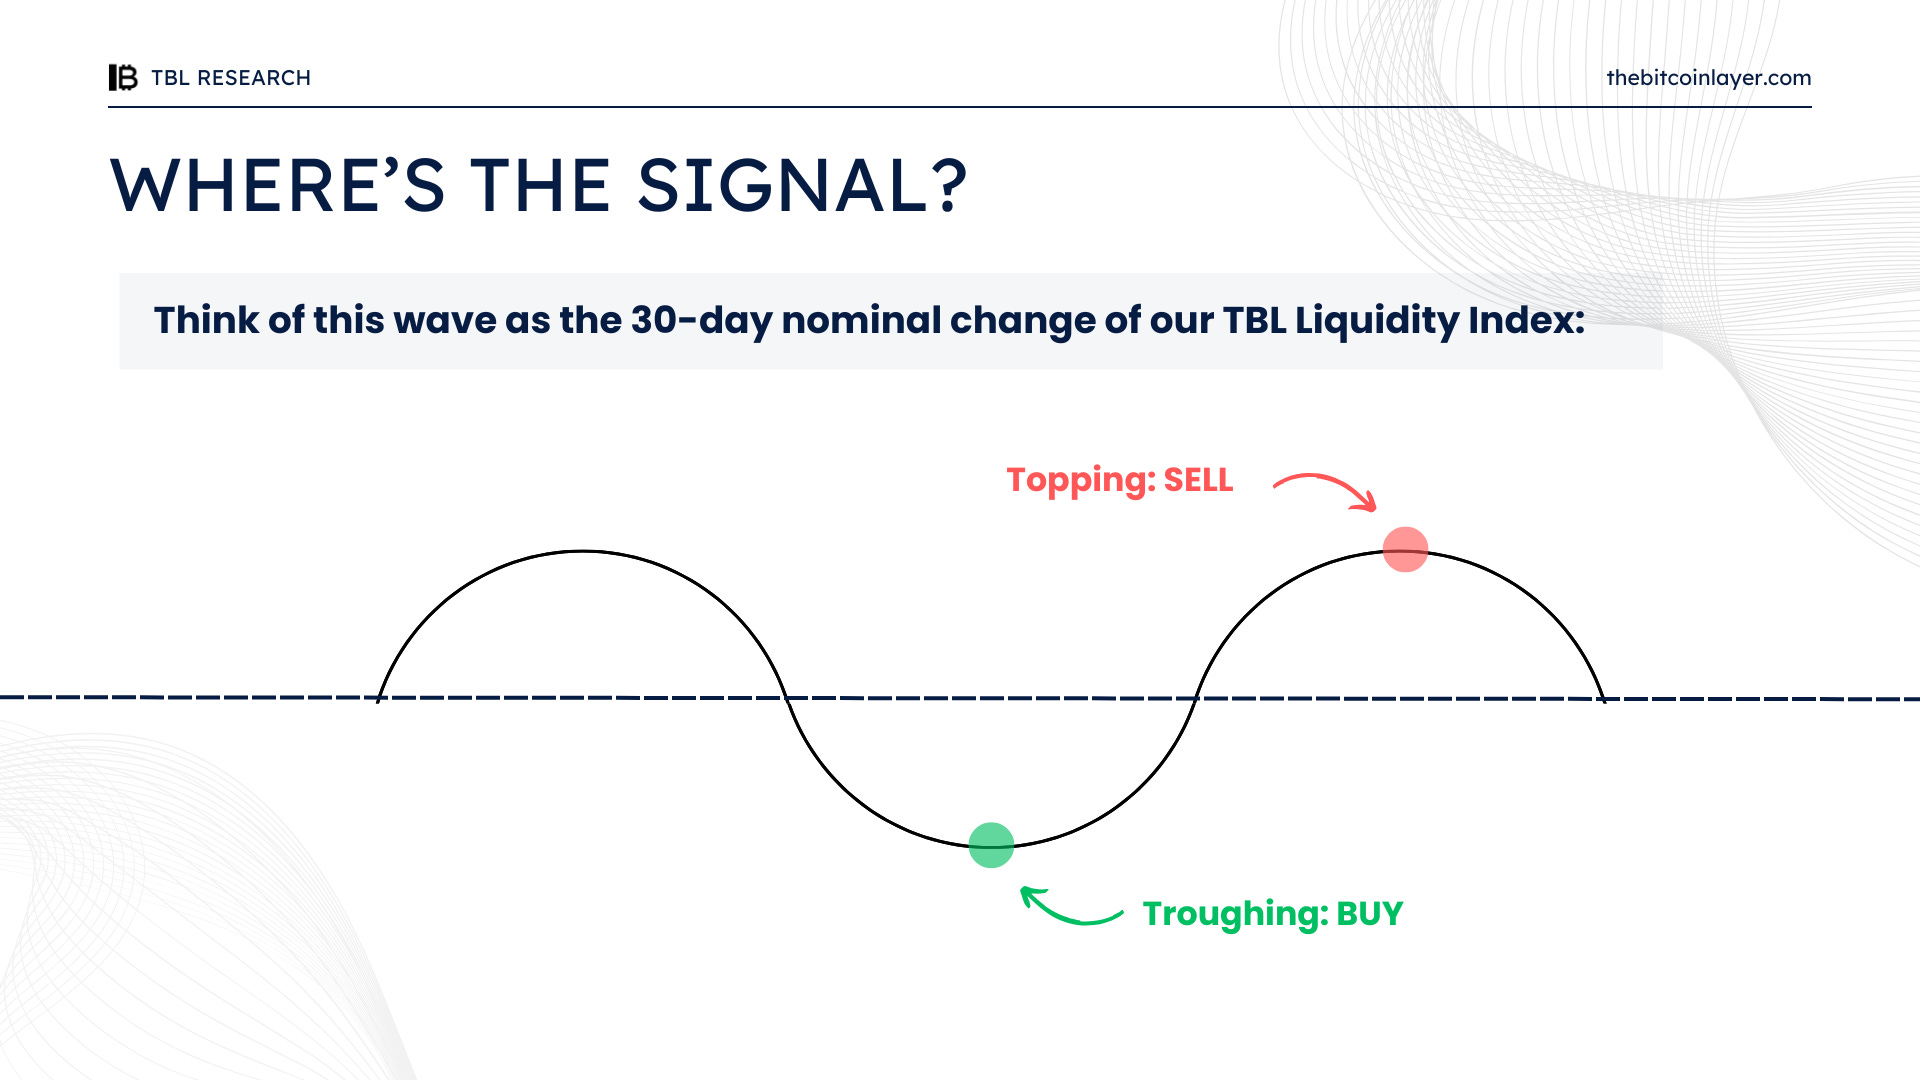
Well, as it turns out, we found some signal using this method and wrote about it back in May of this year. To keep things short, the 30-day change of our TBL Liquidity Index logically produces a wave whose troughs and peaks match with local bottoms and tops in risk assets—here’s a diagram showing what we mean:
Great! We now have a wave that can trigger buying and selling points, but how can we utilize it in real-time? After all, the wave isn’t as perfect as it appears in the diagram above. The 30-day change is a choppy and unpredictable wave whose tops and bottoms are hard to detect, thus making our trading strategy not very useful for timing markets:
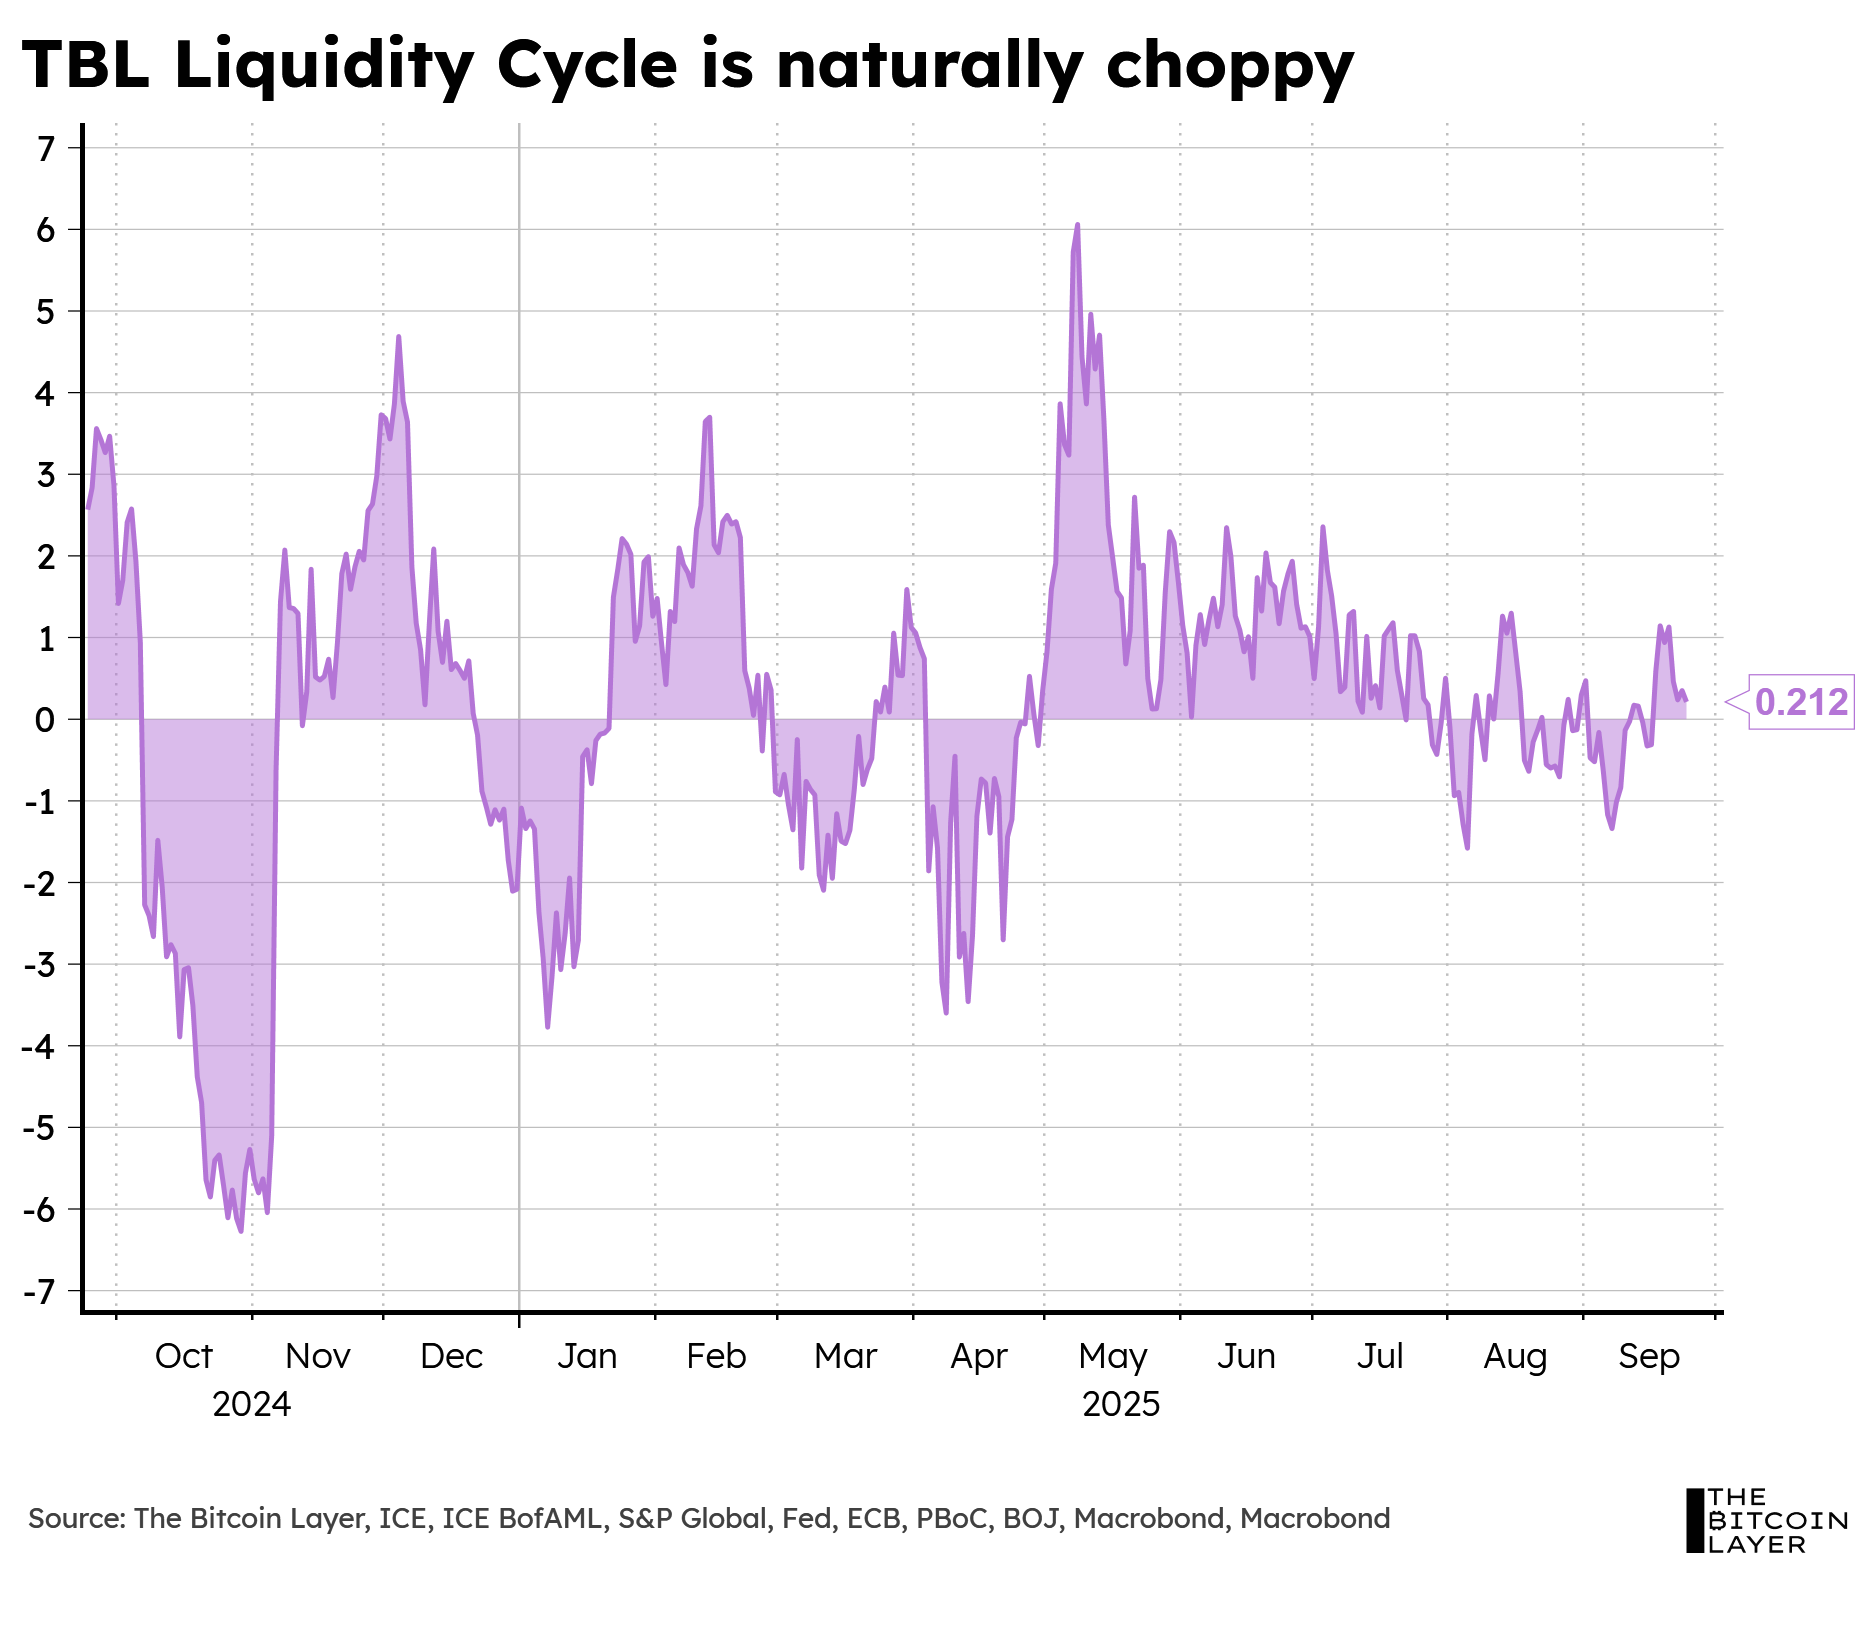
So, once again, we threw this ‘30-day nominal change’ wave back into the quantitative blender…
Step 3: TBL Liquidity Indicator™ (finally!)
The noisiness behind our raw 30-day change prevented us from seeing its proven high signal, so we needed a way to smooth out the noise (i.e., find a trend from the choppy short-term movements) to confidently define troughs and peaks.
Although we have shown smoothed versions before, this new one uses a specific statistical method that separates trends from cycles, and has no lagging signals (like a moving average would).
So, the final puzzle piece required us to:
Smooth out the 30-day nominal change of our TBL Liquidity Index with this new statistical method.
Use the one-day change (derivative) of this smoothed version to detect troughs and peaks.
Here’s what that looks like (available in your TBL Research Dashboards):
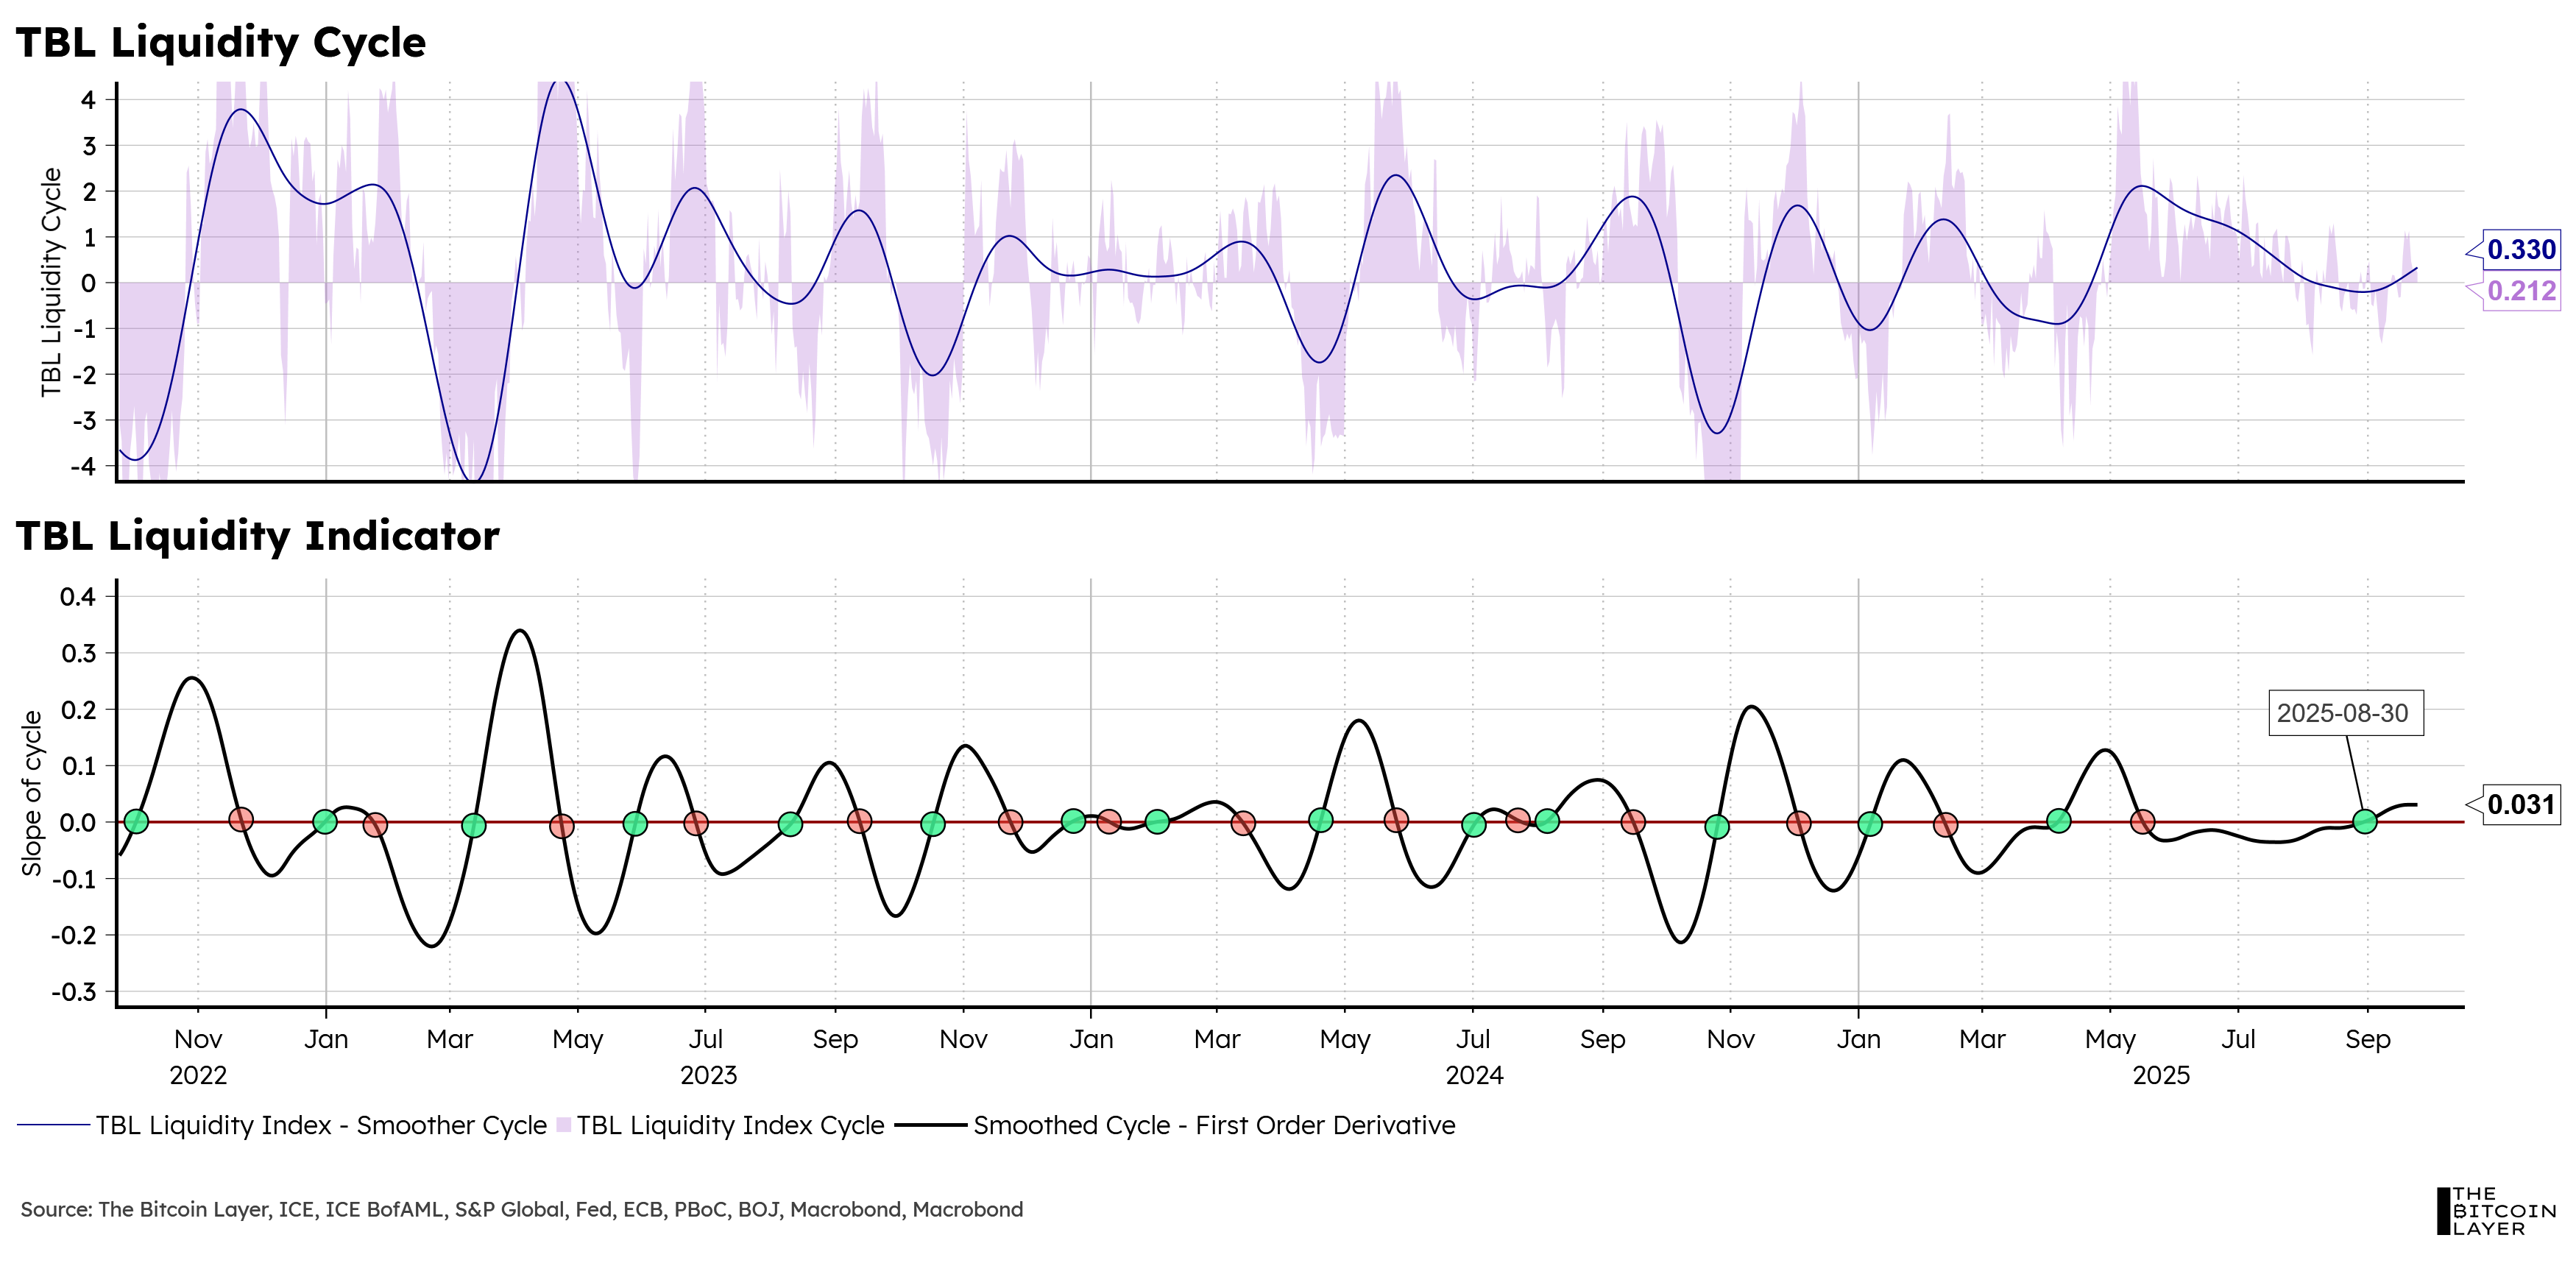
Top pane:
Shaded purple area = 30-day raw change
Blue line = Smoothed version of 30-day raw change
Bottom Pane:
Black line in bottom pane = 1-day change of smoothed version.
Here’s how to read our TBL Liquidity Indicator™:
When the black line in the bottom pane crosses above the zero line = local trough = buy
When the black line in the bottom pane crosses below the zero line = local peak = sell
Step 4: Backtesting results
Okay, now that we have our TBL Liquidity Indicator™, how effective is it? In other words, how good a strategy is it to buy and sell when our indicator says to do so?