TBL's Comprehensive Macro Analysis Framework
Here's our present-day markets analysis using our full suite of tools: the intricate global macroeconomic watch.
Dear readers,
Today we bring you behind the scenes of our global macro framework. The full suite of tools we use to analyze markets. Conceived by Nik as an intricate, global, macroeconomic watch; hundreds of gears and cogs all moving in tandem. This is a comprehensive global macro update as of today, September 30th, 2022. Let’s dive in.
Voltage helps you solve the biggest problem with Lightning nodes and scaling. No more headaches with maintenance, reliability, or uptime issues. Voltage makes running Lightning instant and now easier than ever. These radical improvements to Lightning empower startups and enterprise brands to bring incredible applications and services to market. You can also spin up a personal node and pay by the hour. Scale your infrastructure as fast as Lightning itself.
Create a node in less than 2 minutes, just visit voltage.cloud
Today’s topics
Risk assets are falling below their cycle lows as the selloff continues.
Rates are historically elevated (looking back 15 years).
Commodities and economic data clearly point to a slowdown.
Long-term correlation study shows both bitcoin and gold are monetary inflation hedges.
Bitcoin adoption persists regardless of the global derisking.
Risk
We start off at the top of the watch with credit. Right now, credit is experiencing elevated stress. Off the back of historic monetary tightening from the Federal Reserve, interest rates near and far have been forced skyward. First, we look at CDX HY spreads, a measure of the price of default protection for high yield, which is a proxy for the credit risk priced in for less creditworthy borrowers. The blue line is 2022, compared to the past five years, excluding 2020 and the COVID-related shock, credit stress is at historically wide levels. Less creditworthy borrowers are feeling the heat:
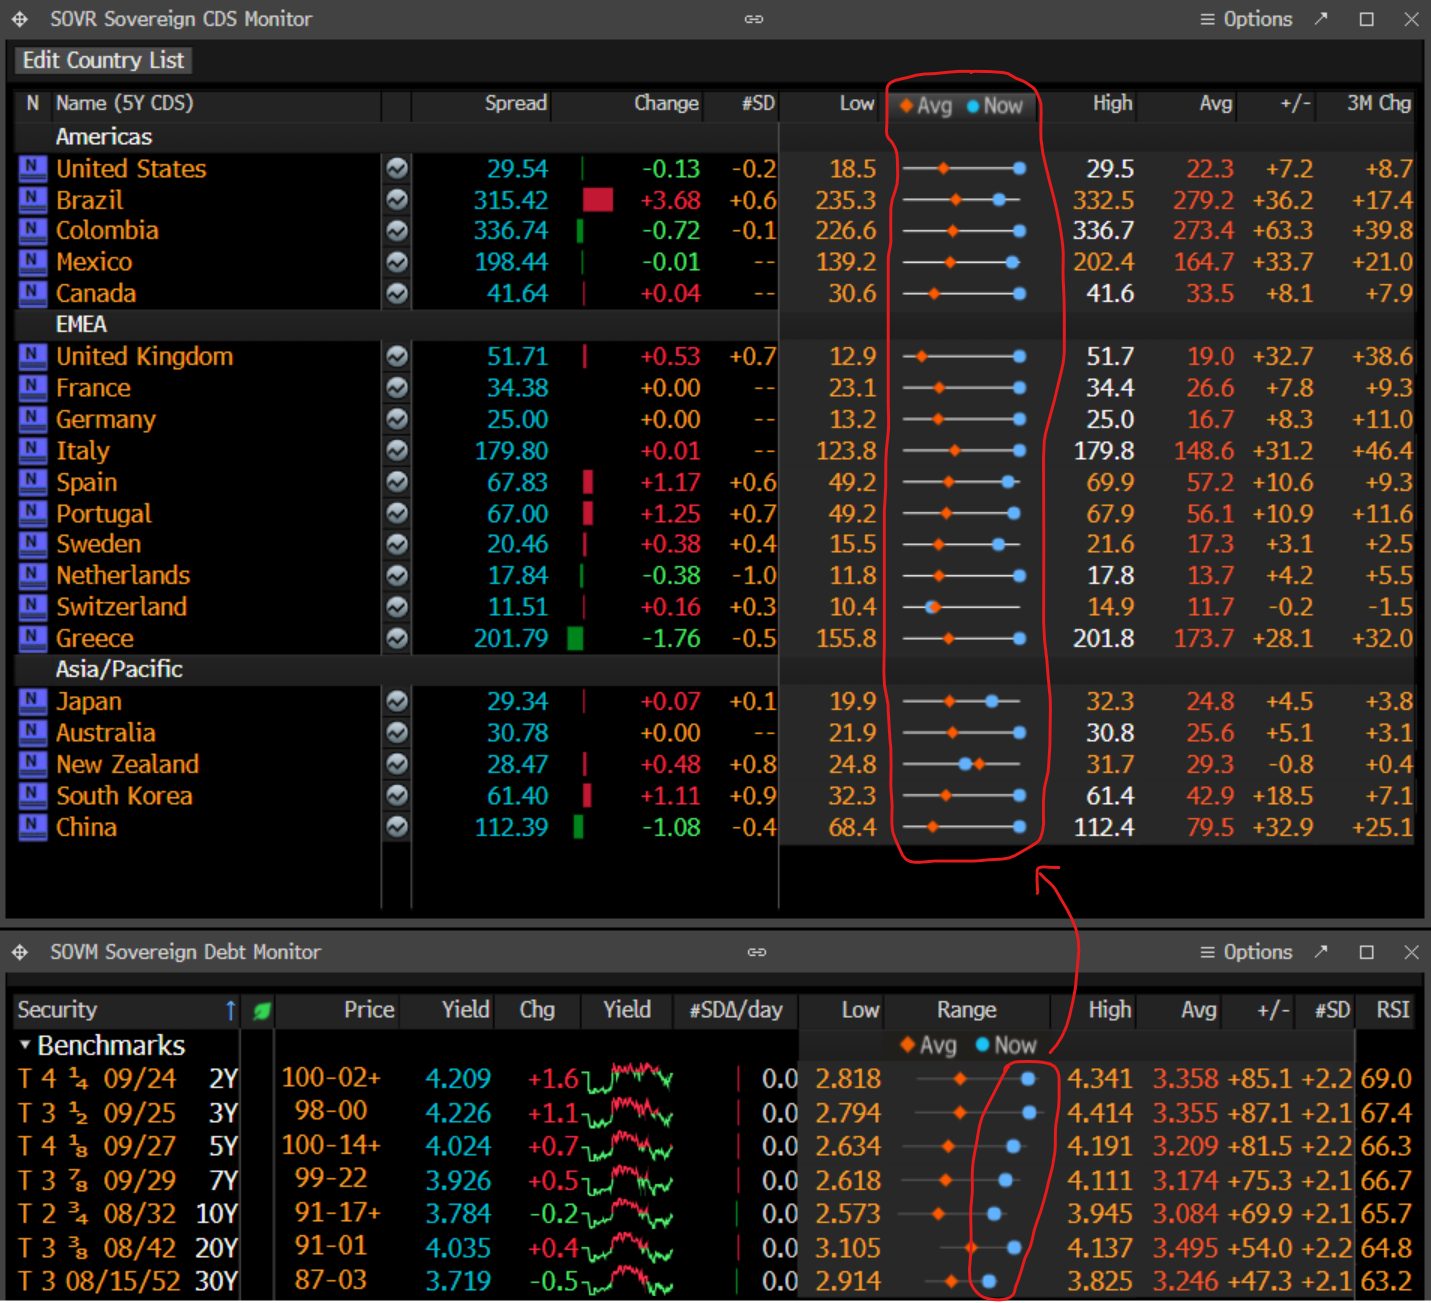
It’s not just the lowest end of the credit totem pole, take a look at sovereign CDS spreads. Higher Treasury yields circled below have sent the price of credit protection for a lot of the Western world’s governments skyward:
Right now, elevated rates are made worse by increased overall credit spreads—for every grade of borrower.
Moving away from credit we go clockwise and take a look at equities. Equities are interest rate sensitive. Higher rates can lead to the selling of equities to get into cash or bonds as people shift into less risky investments, but it also means higher discount rates for companies’ expected future cash flows, which results in lower valuations. As rates have skyrocketed as previously mentioned, equities have moved in the opposite direction. Right now the S&P500 has sold off below its June lows:
With a hawkish Fed, equities selling off is a positive for the central bank. In its mind, falling asset prices mean people are less inclined to spend due to the reverse wealth effect, helping push price inflation down. As long as the global economy remains fragile and uncertain, expect equities to stay less favorable for investors.
Next, we look at bitcoin, which has held up comparatively well to equities in recent weeks. Bitcoin has had strong behavioral support in the $17k - $22k range. Bitcoin continues to base around its cycle lows reached in June:
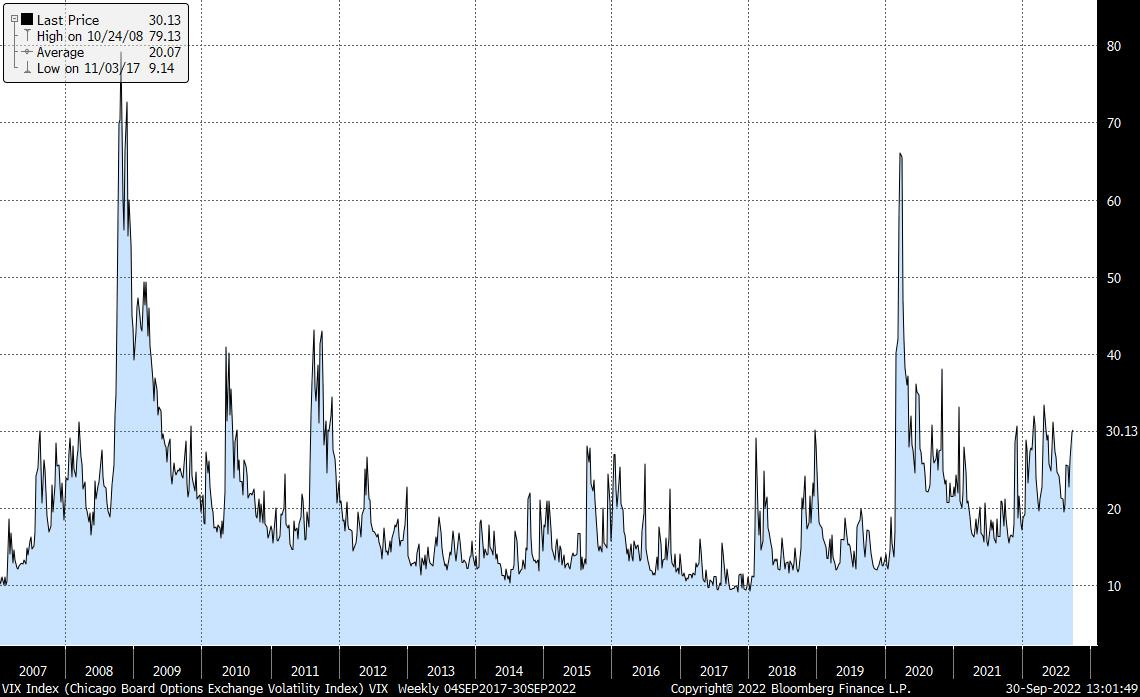
Lastly on the risk watch, we look at VIX. VIX is a measure of the stock market’s expectations for volatility based on derivatives contracts. You can see that VIX chopped upwards during the second-to-last Fed hiking cycle in 2007. As the Fed runs the risk of overtightening today, we see a similar pattern of higher highs on the VIX. Higher volatility is being priced into the market, higher risk of something in our financial plumbing going awry:
All told, risk markets seem on standby for continued Fed tightening. Credit spreads are widening, equities and bitcoin are at their lows for the year, and volatility is being increasingly priced into the market.
Rates & Money Markets
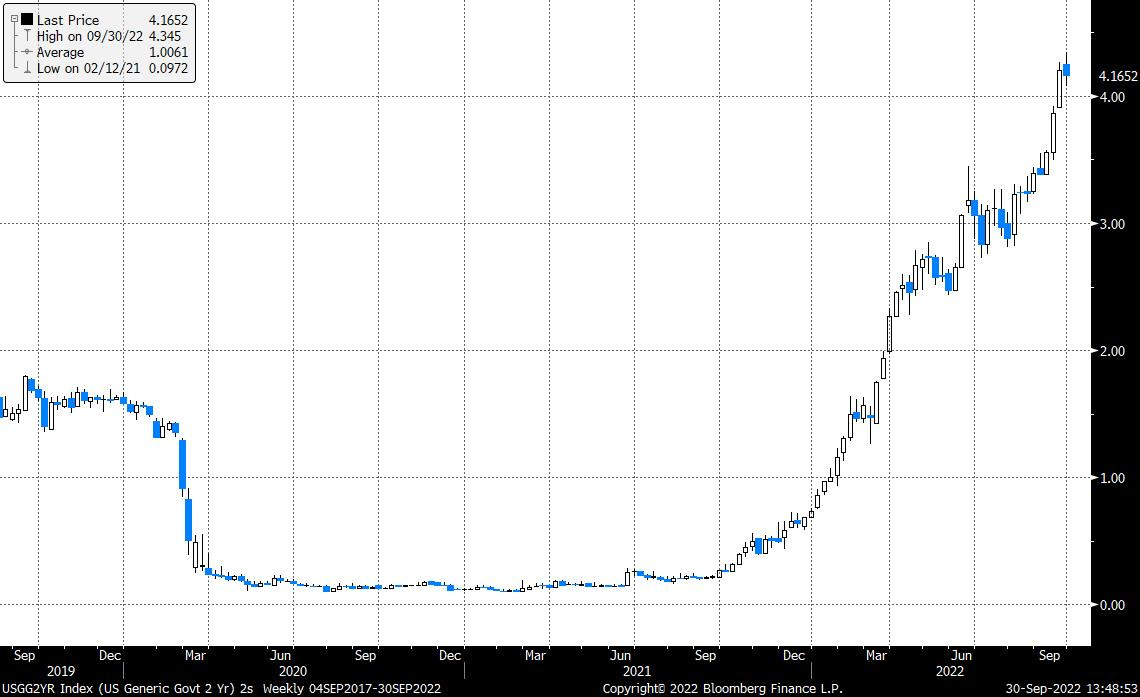
Moving on to what makes the watch tick, rates & money markets. The US Treasury market has the most widely used suite of reference rates in the global economy. They are used as a jumping-off point for writing every form of credit you can think of. Their influence is unrivaled. Right now, US Treasury rates have undergone their most swift upward repricing in since the early ‘90s, off of a very determined-to-hike Fed:
For the better part of 14 years, the 2-year yield and other reference rates have been locked near 0.25%. That introduced a lot of cheaply-financed debt into the global economy. Now rates that companies have to contend with are higher than 4%—that’s a 16-fold increase in the benchmark rate. This is boiling default risk to the surface, as the risk of not being able to finance at these higher rates rears its ugly head.
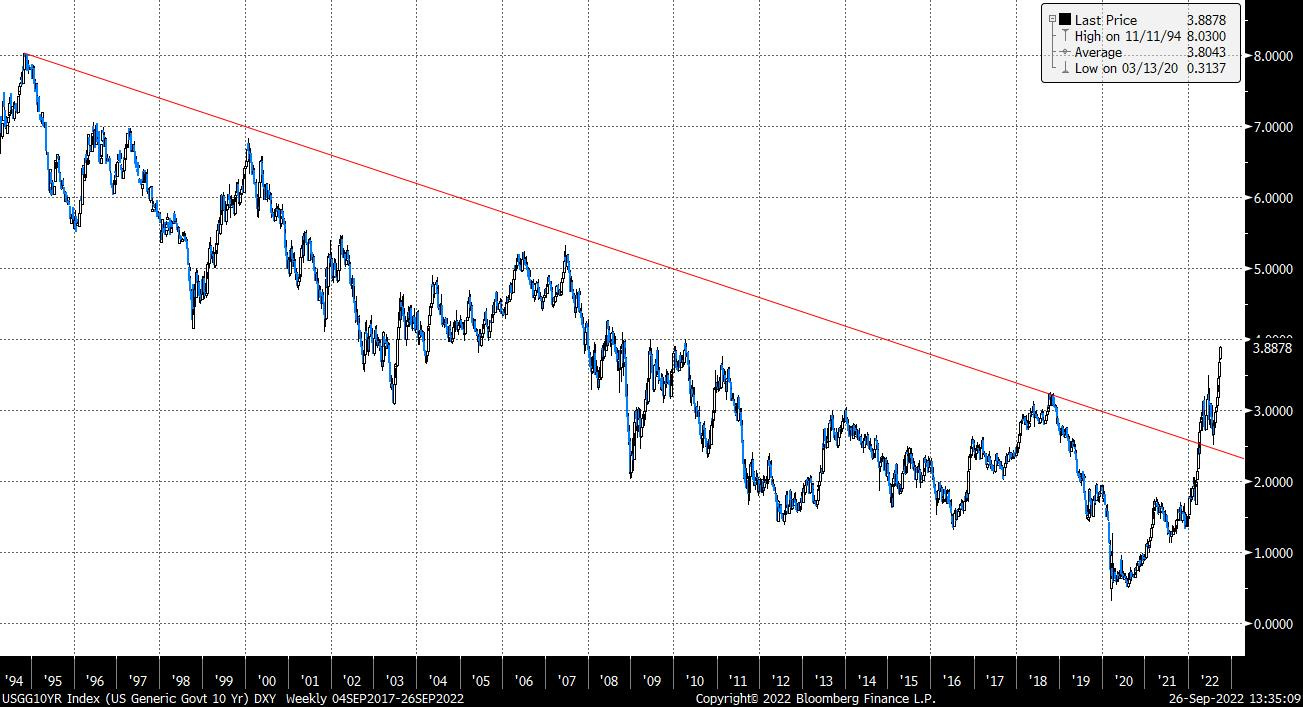
What’s more, the 10Y yield has broken out of a multi-decade downtrend, signaling that forward nominal growth expectations are still robust. The signal from the Treasury market is that the Fed has a lot of tightening on its hands to achieve its stated goal of taming growth to slow inflation:
Yield curve inversions are a signal of policy error. When a longer-dated maturity has a lower yield than a shorter-dated maturity in the Treasury market, the Fed has created a distortion. Right now, the 2s10s curve (10-year minus 2-year yield) is inverted, which historically precedes a recession:
Elsewhere in money markets, global bonds are experiencing the same dynamic of soaring yields. The Bank of England intervened by purchasing long-dated UK bonds to prevent a selloff that would have pushed yields even higher. This is the second—after the Bank of Japan—of possibly more central bank interventions to cap yields that we will see in some form this cycle.
Commodities & Economic Data
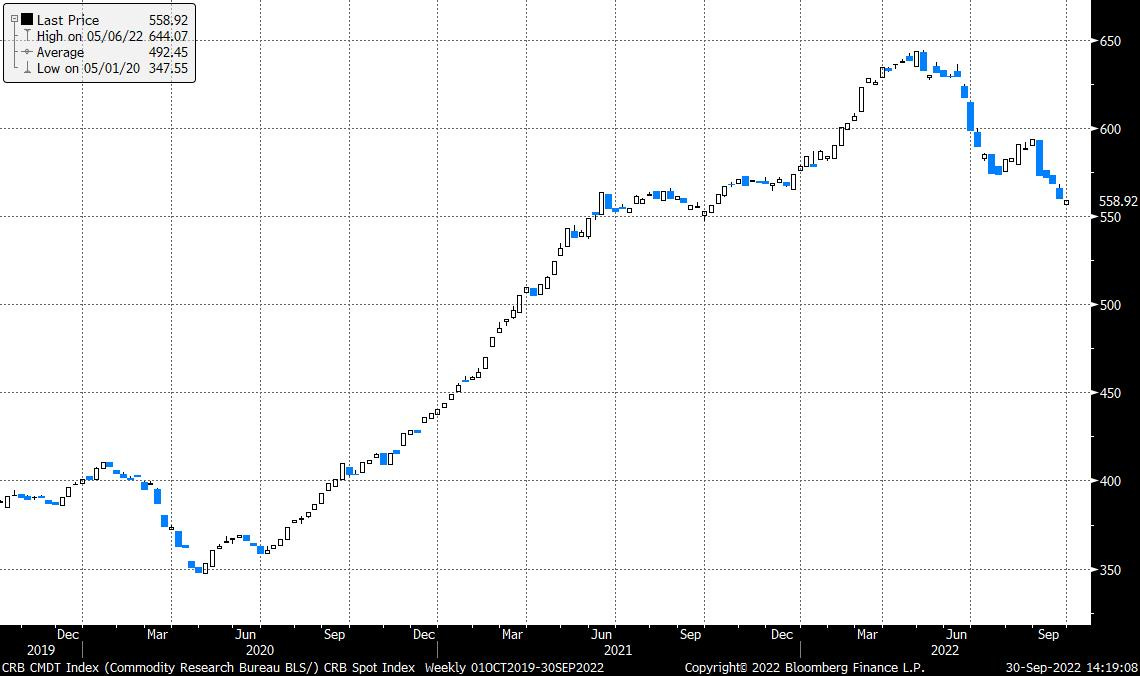
Next, let’s look at commodities & economic data. Falling commodity prices and economic data are signaling a global slowdown in activity. The CRB Commodity Index—a spot index for all major commodities—has fallen precipitously from its highs:
Copper, known colloquially as Dr. Copper, has also sold off sharply. Due to its use in so many end products, Dr. Copper is an accurate bellwether for the direction of the global economy. Prognosis? Contraction:
Economic data validates what commodities are signaling. With our Economic Cycle Wayfinder, we take a series of economic surveys from manufacturers, businesses, and consumers and create a weighted average. Currently, economic health is making lower highs. Although it had a slight rebound, there aren’t enough data points to signal a trend reversal. Global economic activity is still in contraction territory:
All told, commodities in confluence with economic data signal a sharp decline in economic activity. The global growth phase of this cycle has sputtered to a halt.
Correlation Study
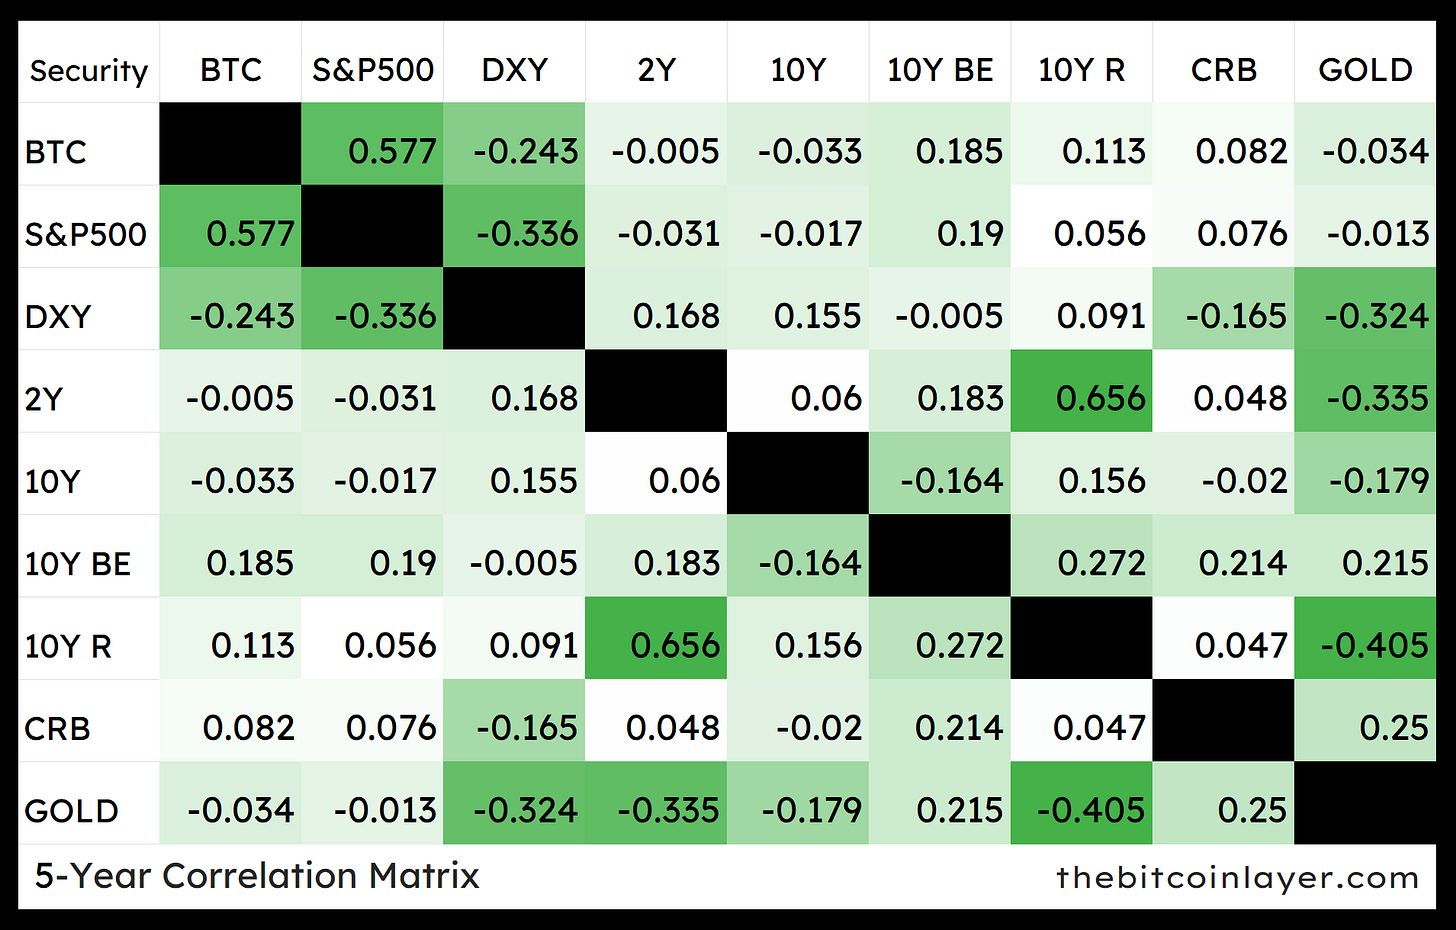
Tying it all together, we use a 5-year correlation study across asset classes. Above all else in monitoring market cycles, zooming out is important. We watch long-term correlations to identify secular trend shifts. The 5-year correlation study indicates that both bitcoin is strongly tied to the S&P 500 and other risk assets.
Gold and bitcoin are both modest dollar hedges—look at their negative correlation to the dollar. When the dollar falls in value, bitcoin and gold rise and vice versa. However, gold is currently a more stable hedge due to its deeper liquidity profile.
Bitcoin Adoption
Finally, we observe bitcoin adoption. The underlying nervous system of The Bitcoin Layer is to document bitcoin on its journey to $500,000 and beyond. One of the ways we do this is by zooming out and observing secular network growth trends, not just price action, and market capitalization growth. More onramps and more activity drive demand, which drives more liquidity into bitcoin. Looking at the number of active bitcoin addresses, it has chopped back and forth during the price drawdown of 2022, but maintains its secular growth trend:
Active Lightning Network channels are another great proxy for active users on bitcoin’s secondary payments layer because channels are closed as participants leave the network. As you can see, the number of channels has flatlined as price action remains sideways, but continues its secular uptrend of higher highs since 2018, signaling network expansion:
The bottom line: the monetization and active use of bitcoin and Lightning Network continue regardless of price drawdowns and macro uncertainty.
At The Bitcoin Layer, it’s our great honor to continue documenting bitcoin’s monumental rise through turbulent markets, providing our insights and analysis to guide readers along the way.
Until next time,
Nik & Joe
The Bitcoin Layer is sponsored by Voltage: provider of enterprise-grade Bitcoin infrastructure. Create a node in less than 2 minutes, just visit voltage.cloud


