

The Risk & Fallout of Fed Overtightening
As the Fed aggressively raises rates to fight inflation, credit and other financial stress rises. What has the highest risk of breaking as the Fed holds tight?


Dear readers,
In 79 AD, Mount Vesuvius located in Southern Italy erupted for the first time in nearly 300 years. The volcano’s molten lava destroyed the city of Pompeii, along with thousands of residents within minutes of eruption. The residents of Pompeii hadn’t lived to see an eruption, and neither did their parents or grandparents before them—the dormancy of Mount Vesuvius was mistaken for safety, with cities and populations nonchalantly expanding along the base of the volcano.
In markets, inactivity is also mistaken for safety, when in actuality, pressure may be building under the surface unbeknownst to the casual observer. Every cycle, participants take on an increasingly higher risk profile during periods of stability. Like the citizens of Southern Italy that continue building grand cities at the foot of Mount Vesuvius, markets will be caught offside eventually.
Things are calm now, but if a gradual release of that pressure can’t be achieved, the build-up may give way to a massive, uncontrollable release. As the Fed continues tightening financial conditions to fight inflation, it risks elevating stress beyond a point that markets can deal with. If the Fed overtightens, what is the release valve, and how extensive will the fallout be?


Voltage helps you solve the biggest problem with Lightning nodes and scaling. No more headaches with maintenance, reliability, or uptime issues. Voltage makes running Lightning instant and now easier than ever. These radical improvements to Lightning empower startups and enterprise brands to bring incredible applications and services to market. You can also spin up a personal node and pay by the hour. Scale your infrastructure as fast as Lightning itself.
Create a node in less than 2 minutes, just visit voltage.cloud
Parallels to Black Monday 1987
Markets move in cycles—multi-decade and multi-year periods of rising and falling around a trend of positive real growth. These cycles often rhyme with one another, and some components of the risk landscape line up with the conditions leading into Black Monday 1987, when the Dow Jones fell a record 22.6% in a single day.

In 1987, rising inflation pushed central banks to raise rates aggressively, even as financial stress rose—this is also the case today. Can the Fed’s aggressive tightening spark systemically threatening financial stress today?
There are some key differences between the two regimes that make today’s market landscape more robust, namely excess liquidity in a post-QE financial system.
Black Monday 1987:
Booming stock market
Expanding economy
Rising inflation
Rising interest rates
Post-QE excess liquidity ❌
Today:
Falling stock market
Contracting economy
Rising inflation
Rising interest rates
Post-QE excess liquidity ✅
We live in a post-QE world, in which global liquidity is in excess. There has never been more excess liquidity in the system to act as a cushion for tightening financial conditions—so unlike the violent unwind of 1987, today’s cycle downturn has played out in slow motion thus far.
This is perhaps one reason why Fed & The Gang has had the gusto to tighten in aggressive 75 basis-point increments: they’re aware of this liquidity cushion and how much of a problem it poses to their inflation-fighting mandate. Where is pressure building in markets? What is the risk of each erupting?
Gauging Markets’ Subterranean Pressure

Volcanic eruptions are a matter of pressure.
Let’s wind our economic watch to reflect current conditions in rates, credit, money markets, and economic data. We’ll explore: where is pressure building in markets, and should the Fed hold policy restrictive, what is the timeline for an eruption?

Rates (US Treasury Market)

We are now possibly at the end of a 40-year bond bull market. US Treasuries have just experienced their worst mark-to-market losses in more than half a century:

The most widely used set of benchmark rates for the world has broken its four-decade downtrend—rocketing higher to the mid-4 handle. Rates on everything from consumer credit cards to 30-year mortgages adjust upward in tandem:

A wall of maturing US Treasury notes and bonds in 2024 will mean tighter financing conditions for the United States government as rates remain elevated:

Conversations around illiquidity in the Treasury market are misplaced for now. The entire curve has seen a steady increase in buyers as the market prices in a looming recession. The main concern with elevated rates is not the US Treasury, which will have to issue higher coupons, it’s the companies that use USTs as a benchmark for raising debt capital.
Credit Conditions

Credit stress is muted for now. Market-ascribed risk of default via credit default swap indices (CDX) has fallen from its highs after rising for most of the year:


The liquidity cycle precedes the credit cycle. As liquidity is sucked from the system by the Federal Reserve holding its policy rate higher and doing QT (destroying reserves), lenders will gradually back away from the market as the tolerance for risk-taking wanes. This can lead to higher spreads going forward; for now, conditions remain mild and corporate issuance has gone on smoothly. Buyers are still here.
Debt & Equity Capital Markets

Corporate debt roll-overs will be in the headlines over the next six months and well into 2024. Rising interest rates will see corporations with maturing debt and financing needs ‘roll’ their debt at a higher rate over the next few years. Last year, savvy corporate borrowers managed to lock in a low rate and push out their maturity profile into the next couple of years:

Expansion of cheap credit allowed companies to cheaply finance their operations for three years. As rates stay higher for longer, waves of default will likely occur among those borrowers who can’t stomach a positive real cost of capital.
Shifting over to equity, buybacks have been a mainstay for the last 14 years of ZIRP. Following the Great Financial Crisis, once the Fed locked policy rates at the zero lower bound and held them there, corporates took on cheap debt to finance share buybacks. This trend has persisted as the years go on:

This accounting gimmick boosts companies’ earnings per share (EPS) because the share count declines. Elevated rates will restrict these buybacks, which is not a stick of dynamite for global markets, but more of a melting candle if the marginal buyer of stocks feels rather shy. Take a look at just how much S&P 500 price action has been attached at the hip and influenced by share buybacks:

Money Markets (Overnight & Short-Term Dollar Funding)

Short-term dollar funding markets are functioning fine for now. FRA/OIS, a key barometer we use for funding stress, has calmed down after spiking this year. For now, somewhat of a calm:

Rising usage of the Fed’s discount window is cause for concern, as it indicates that some institutions cannot find other institutions to deal with, so they must go directly to the Fed for liquidity. No hurricane sirens just yet, but eyebrows are now raised:

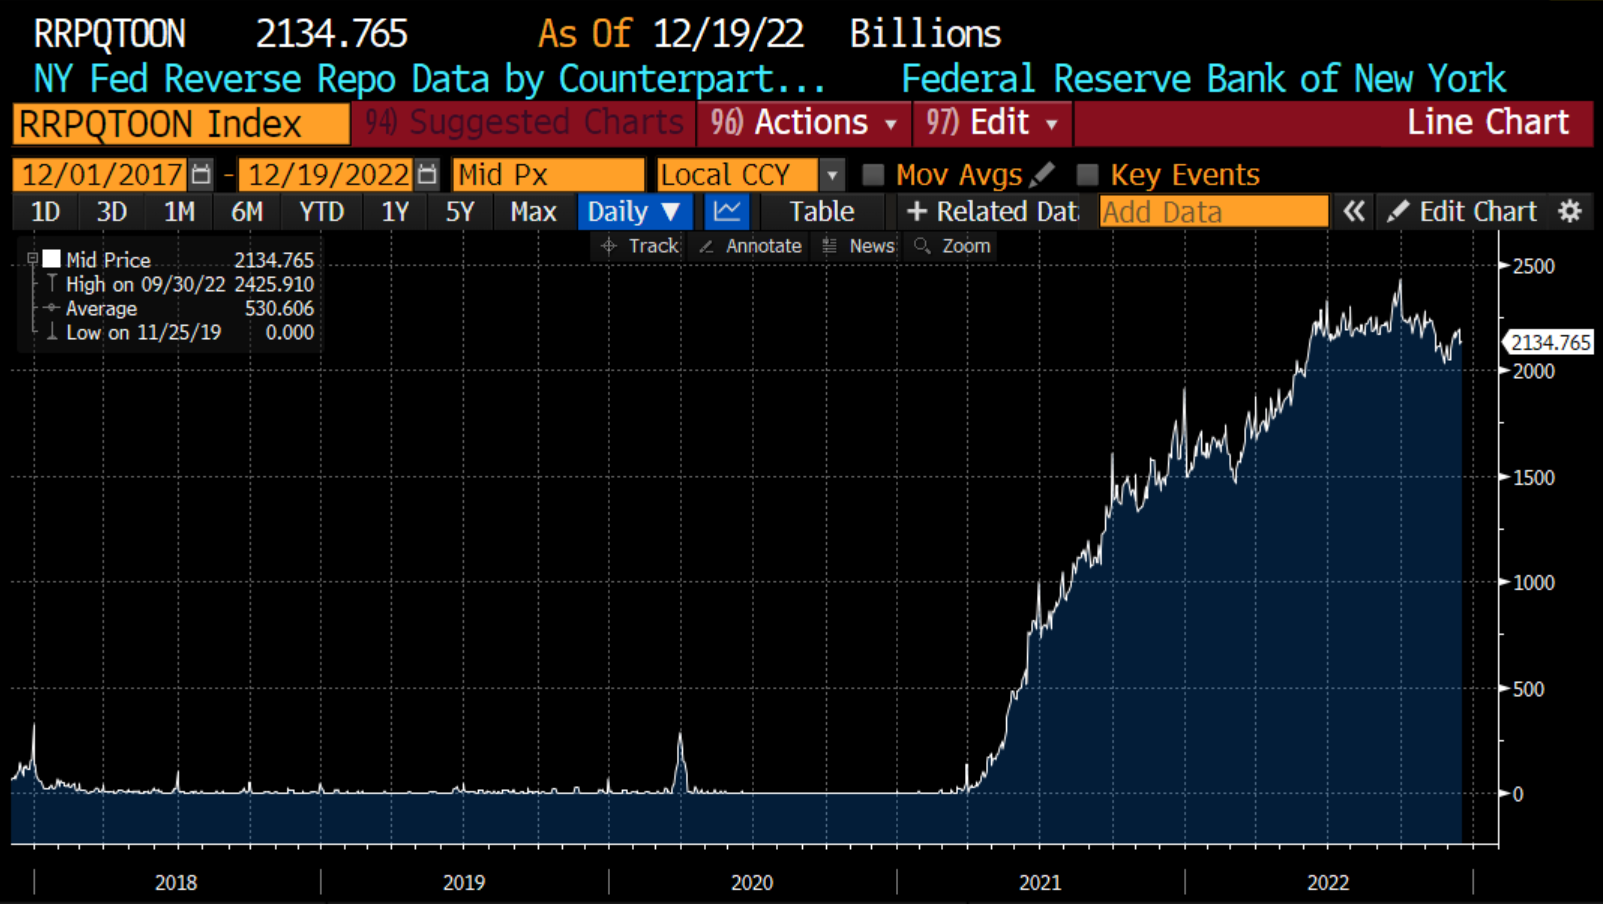
The Fed’s RRP facility (a parking spot for excess liquidity, provided by the Fed to the market) has over $2 trillion of daily usage. Banks are not taking unnecessary risks, preferring instead to capture a cool 4.3% risk-free rate. There is lots of excess liquidity on the sidelines here with the Fed’s RRP:
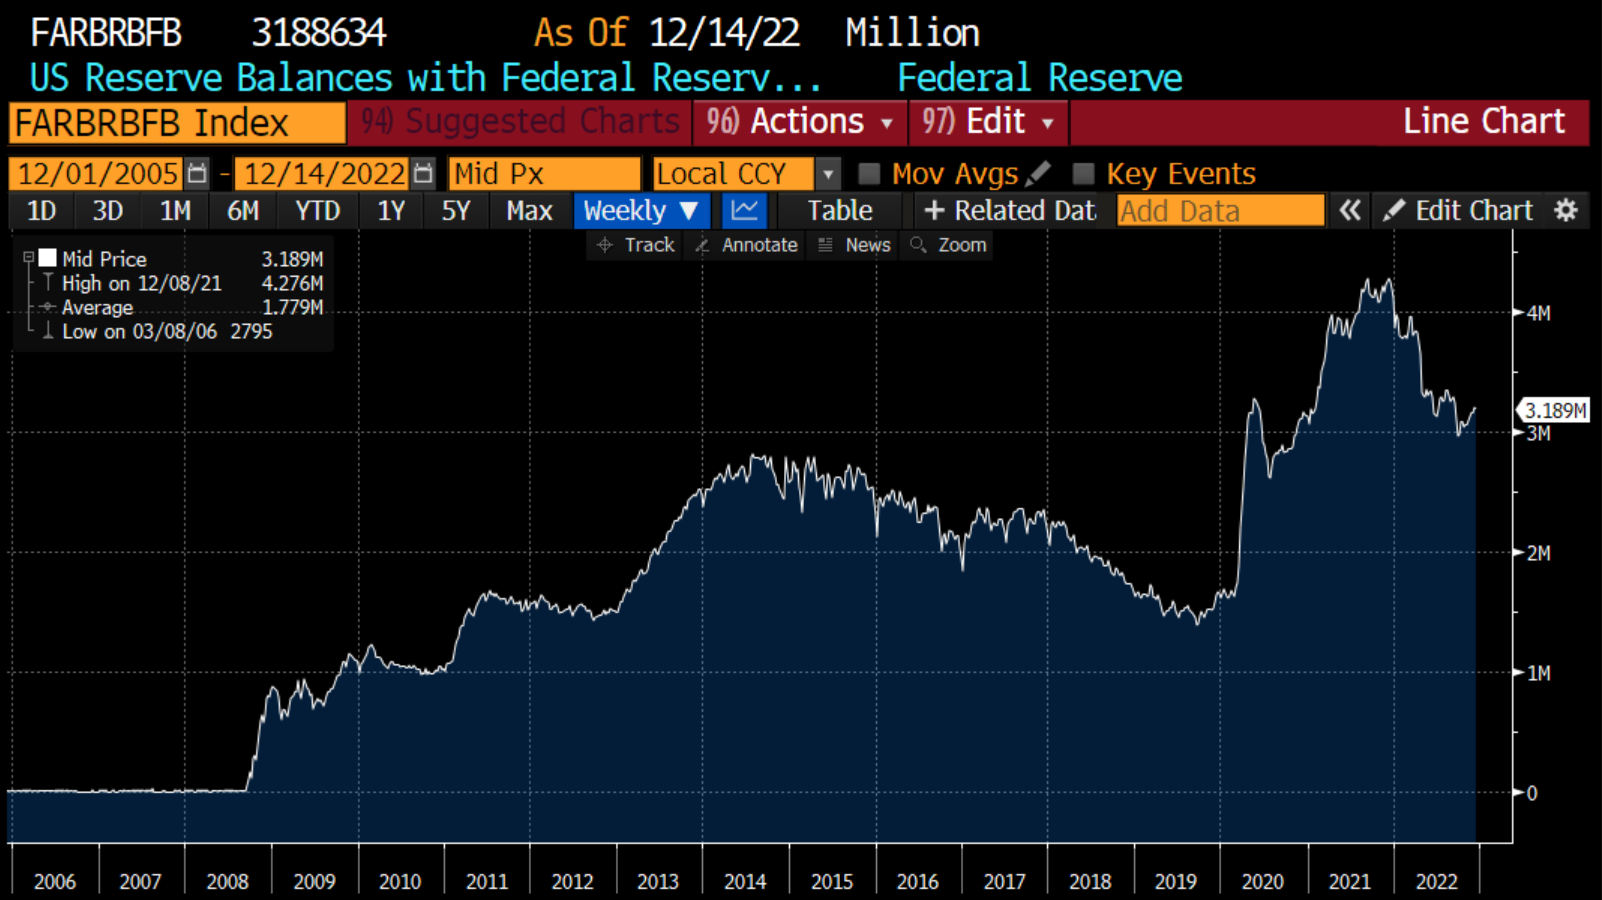
Bank reserves are also very high but winding down since the beginning of QT2 earlier this year. The sensitivity of the market at large to declines in reserves can vary—one day it is fine, the next day interbank funding freezes. We will monitor:
For the time, money markets will likely function without issue. Excess liquidity in the form of capital at the RRP and excess bank reserves should allow critical financial plumbing to operate with steady efficiency for the foreseeable future.
Foreign Funding Markets

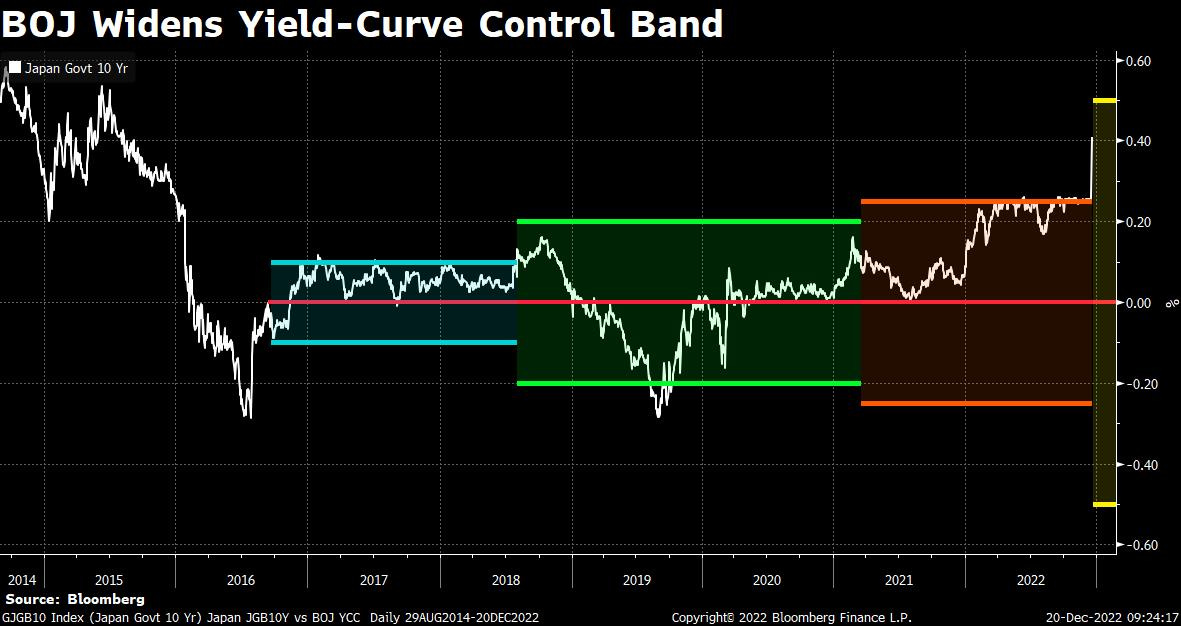
Bank of Japan has relaxed its Yield Curve Control, allowing Japanese 10y notes to sell off as high as the 0.5% mark. The Japanese yen has historically offered the cheapest suite of rates, making it a prominent funding currency for the world. As global financial institutions can no longer borrow in yen as cheaply as they once could, this makes for more financial tightening at the margin:
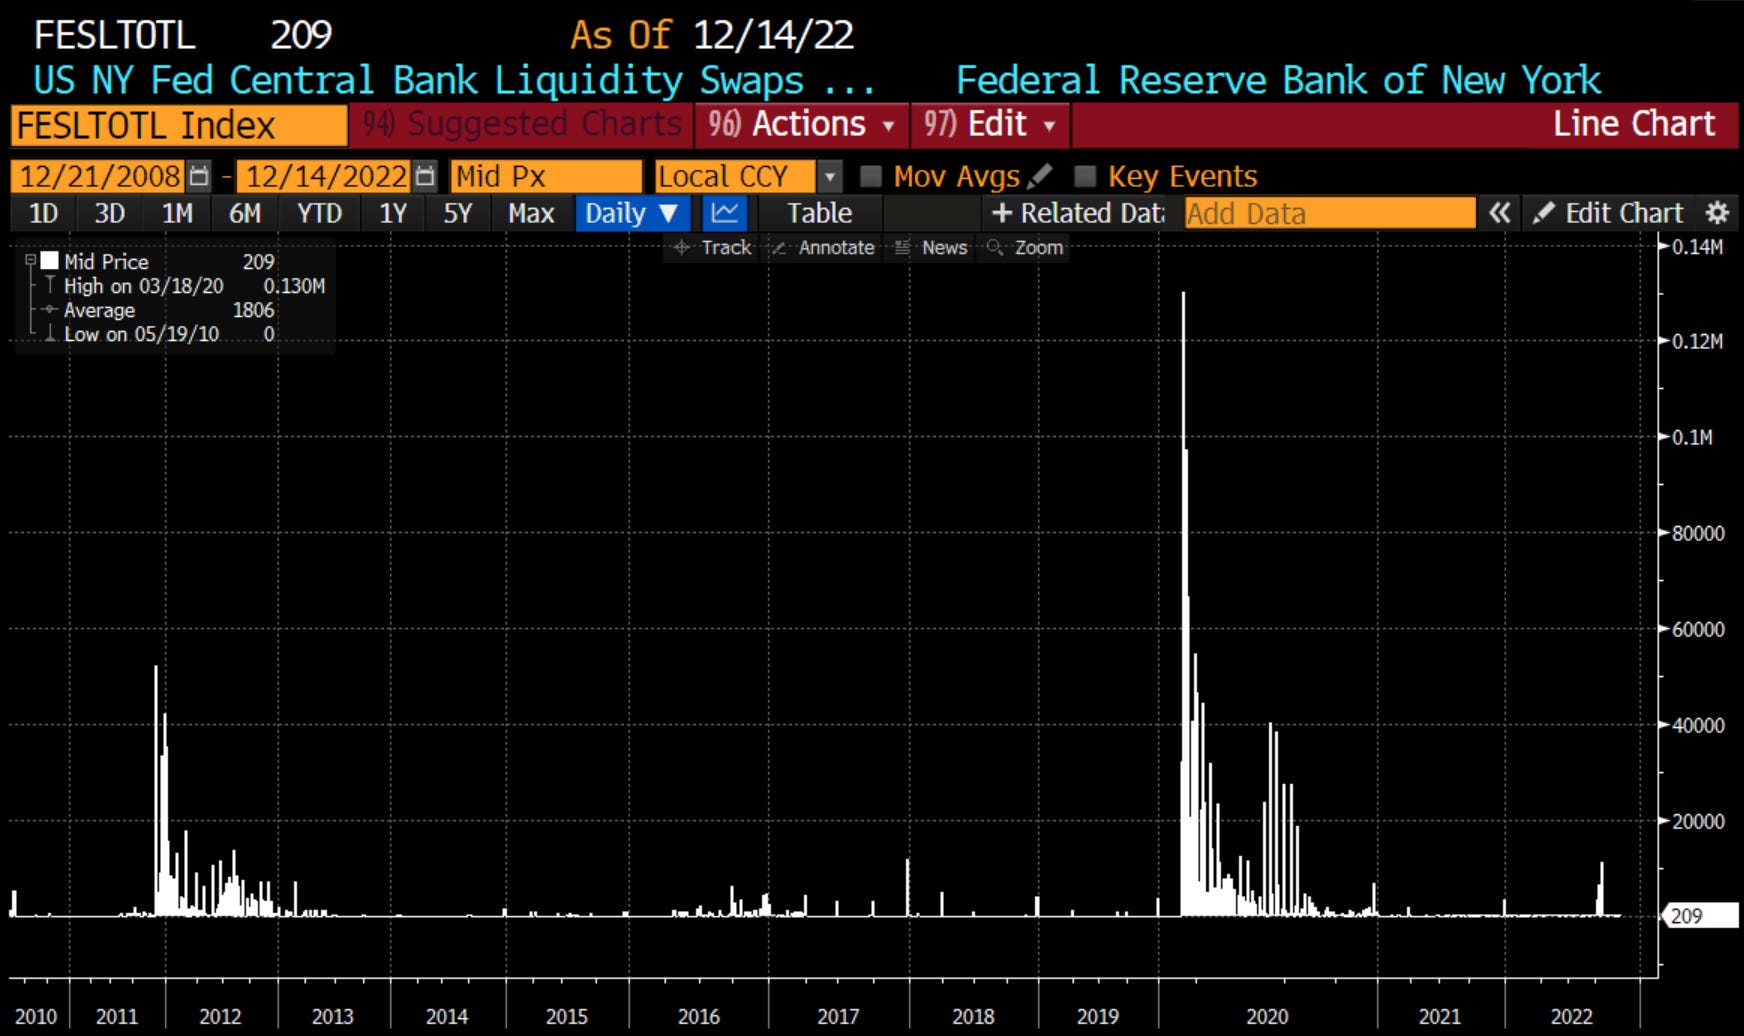
Foreign central bank swap line usage had a spike earlier this year when Switzerland drew billions of dollars from the Fed to siphon to some distressed banks with dollar funding needs. While incomparable to previous spikes, and muted for now, it’s a sign of the global dollar shortage and the potential for more Fed intervention to come for global central banks and the distressed institutions therein:
The fickle, moment-to-moment nature of foreign funding markets, particularly in Europe given its rich history of financial crises in the past decade, means that a crisis stemming from credit or money markets seizing up abroad could occur at any time. The precedent is set that should funding stress emerge outside of the Fed’s purview, the Fed will still become the lender of last resort for those institutions.
Consumer Financial Condition

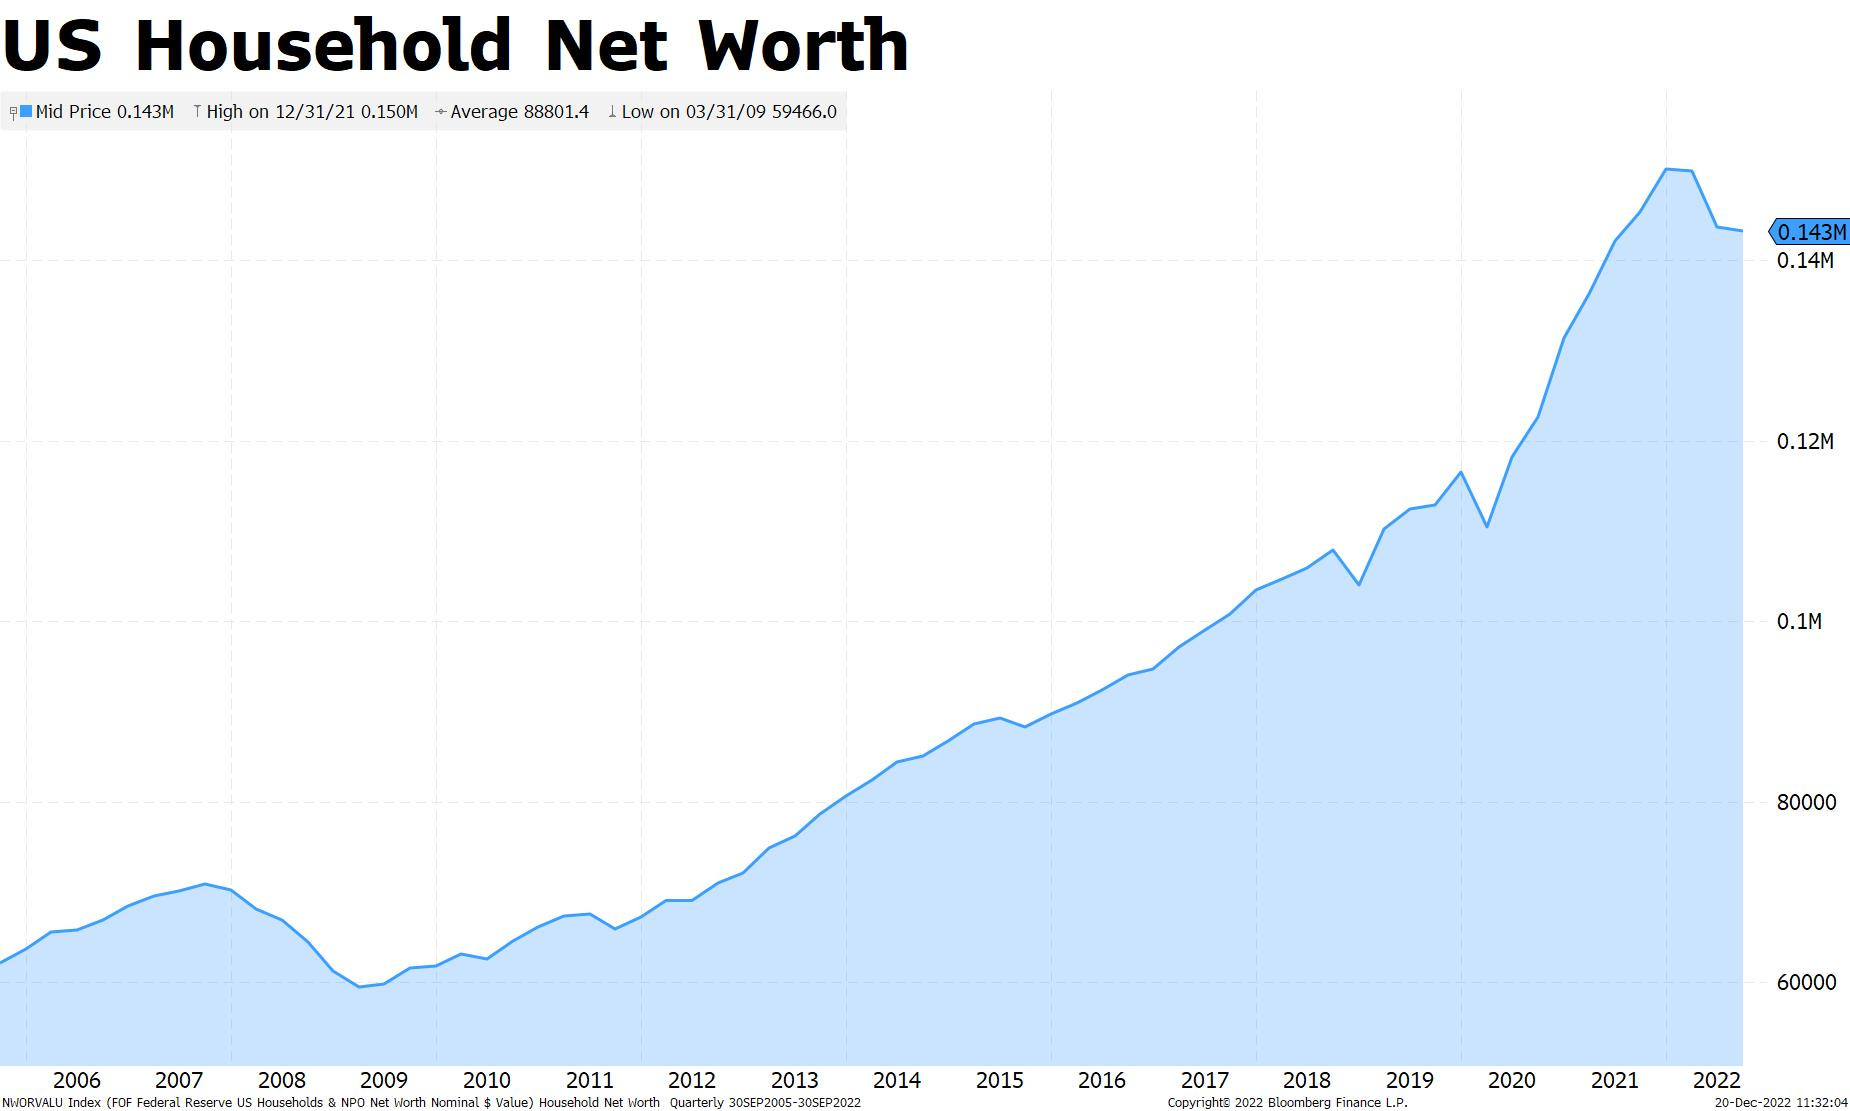
Aggregate US household net worth is falling materially as asset values in stocks, retirement accounts, and home equity have fallen substantially. In tandem, the consumer savings rate has also fallen. Heading into 2023, expect a rise in consumer credit to compensate for a falling savings rate, which may eventually boil over into consumer credit defaults if credit conditions aren’t eased by then:
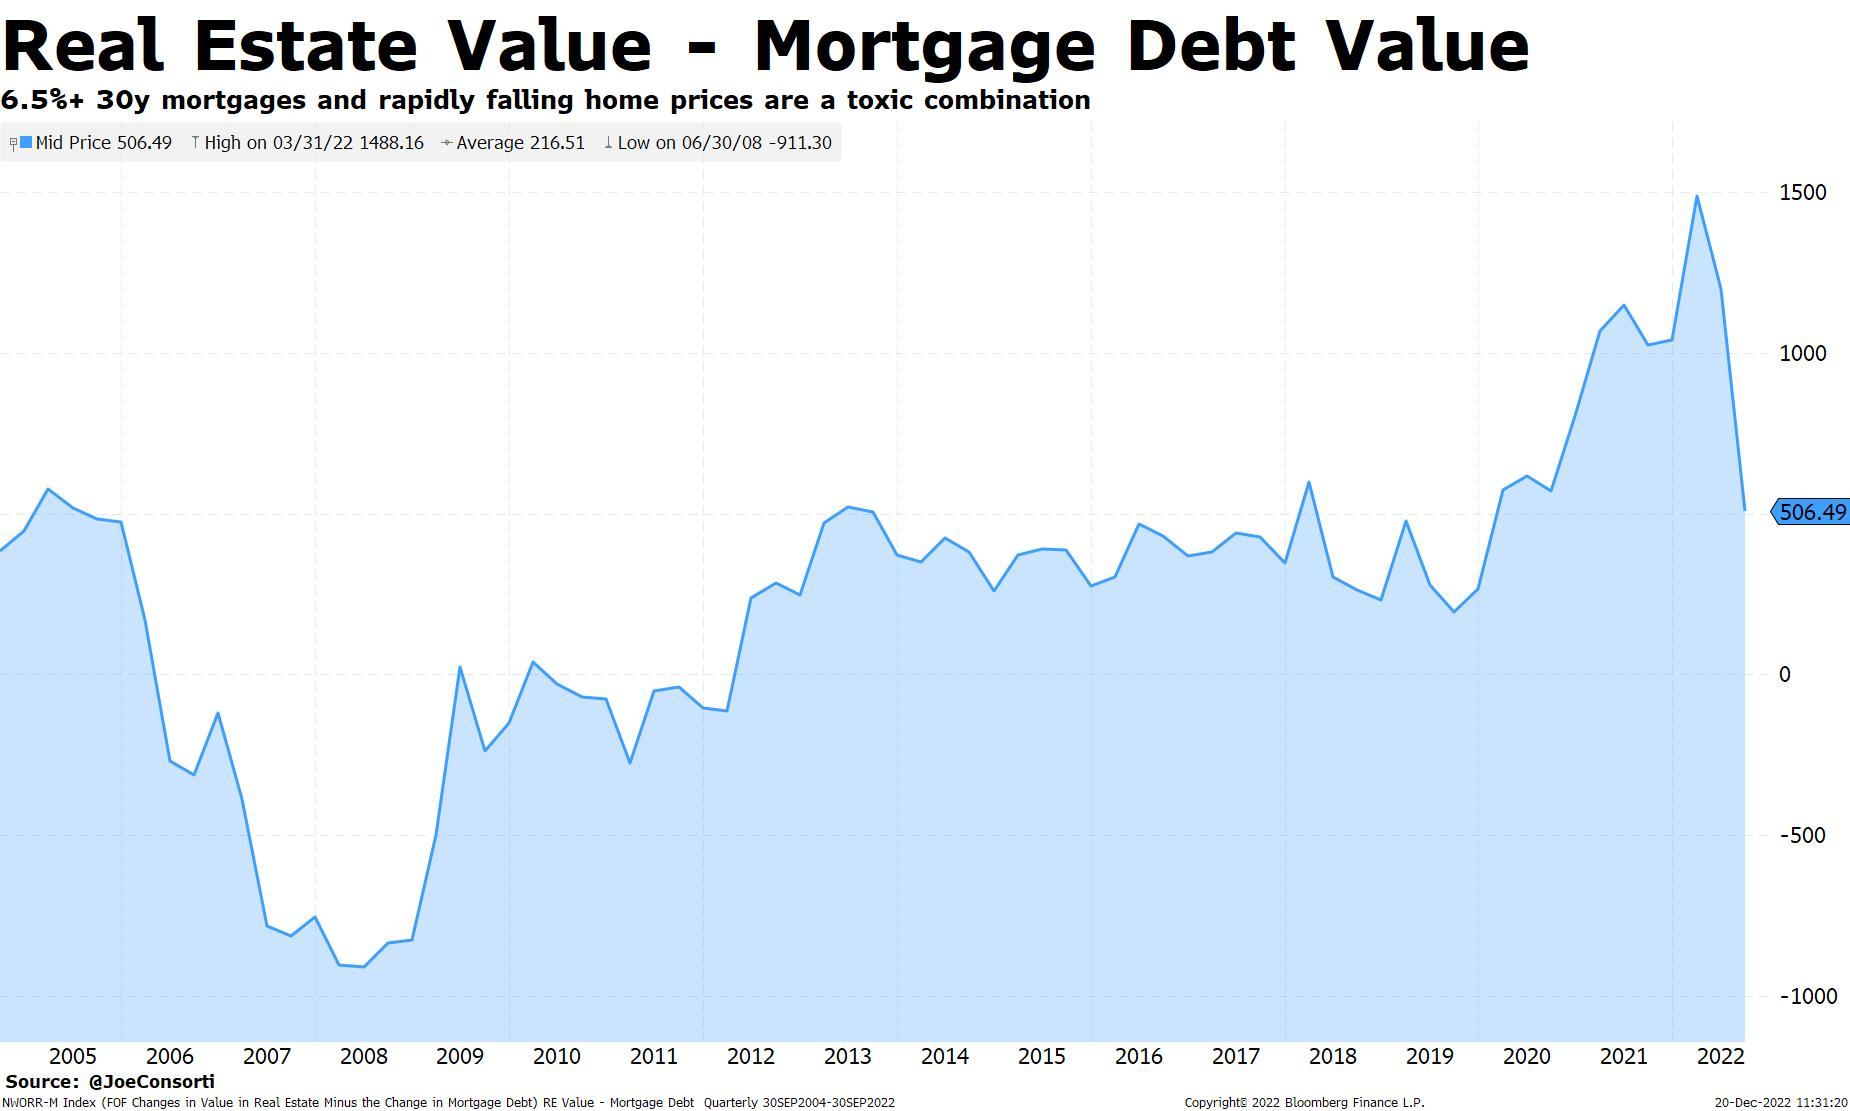
More alarmingly, the value of real estate less the value of mortgage debt at these elevated rates have fallen by one-third, a more rapid deterioration in housing sector value since the years leading into the housing crisis:
The single-family housing market remains robust in spite of this, per the Wall Street Journal. The gap between home equity and debt is very wide—home prices would need to fall roughly 40% from their peak to put the same proportion of mortgaged homes underwater today as during the housing crisis:

At the same time, households are locked in low-debt service. Huge jumps in mortgage rates are slowing new home buyers from entering the housing market, but existing home buyers with fixed rates are unaffected:

Homeowners have a wide equity margin for home prices to fall before their home value is below their mortgage balance, and many have locked in a low rate in the post-COVID stimulus period. Recent guest lectures, including this one with Cullen Roche, paint a more bearish outlook for housing. We’ll be watching home prices and any language from the Fed surrounding the purchase or maturity of mortgage-backed securities in its portfolio.
Soft Landing Or Black Swan?

As pressure builds beneath the surface, there is always the possibility of a soft landing. The soft landing term has been coined by the Fed and financial pundits to mean inflation normalizing at 2%, coupled with a modest growth slowdown, averting a crisis-like crash in markets or the real economy. But if inflation falls slowly and the Fed keeps conditions very restrictive, the risk increases that any one of these presently calm market factors could suddenly convulse and create a domino effect through markets and the real economy. Living in the era of excess liquidity, it’s difficult to gauge when and where a crisis will occur using conventional measures. What we know for certain is that the liquidity cycle downturn precedes credit markets slowing down, which leads to greater volatility. How markets will stomach it is uncertain, but it’s an absolute certainty that volatility will rise as liquidity deteriorates.
It’s consensus among geologists that Mount Vesuvius is overdue for an eruption. And like the markets we’ve juxtaposed against it throughout this piece, we don’t know when that eruption will happen, nor do we know the exact cause; all we know for certain is that Mother Nature is an unpredictable mistress.

Until next time,
Joe & Nik
The Bitcoin Layer does not provide investment advice.
The Bitcoin Layer is sponsored by Voltage: provider of enterprise-grade Bitcoin infrastructure. Create a node in less than 2 minutes, just visit voltage.cloud

Extremely profound report. Awesome.