


There is no bubble bursting in Treasuries
Fed to hike rates another 1% by June as the Treasury yield curve inverts.

I might be early and wrong for a while, but I believe that longer-term Treasury yields have just about reached their peak for this cycle. Within a matter of months, and without the help of Federal Reserve bond purchase programs such as Quantitative Easing and yield curve control, yields will return back down to trend. This post outlines my reasoning, as well as an outlook across asset classes, including bitcoin, for the remainder of 2022. Massive rates overview today with plenty of mini-explainers throughout.
Voltage is the industry standard Lightning Network infrastructure. Voltage currently powers some of the biggest names in Lightning including Amboss, Impervious, Fountain, Podcast Index, Sphinx, THNDR, Zion and more. Creating Layer 2 applications and services on Bitcoin starts with Voltage. Their platform makes it possible to spin up nodes, get access to liquidity, optimize your node, and so much more. Get a free 7-day trial.

Fed to hike 100 basis points

Let’s start with monetary policy. After being caught completely and utterly behind the curve on inflation, the Fed started its hiking cycle earlier this month with a cozy 25 basis points. Chair Jerome Powell hit the tape last week expressing a willingness and eagerness to hike much more, very quickly, and the market acquiesced. The Fed is now slated to go 50 basis points in May and another 50 in June. Here’s a look at the current policy rate priced to each FOMC meeting, implying a policy rate of 2% by September. That’s 175 basis points of rate hikes over the next four meetings. Yup.

I’m becoming convinced the Fed gets to at least a 2% Fed Funds rate. Powell is convinced the economy can handle much higher policy rates without going into recession. With US PMIs at 58, he has no reason to fear an imminent economic contraction. The Fed is also pushing the narrative that fighting inflation is imperative to sustaining economic growth, making rate hikes appear as a bullish impulse for risk markets in a slightly perverse way. Lastly, short-end Treasury yields have already priced in a policy rate well north of 2%, with 2-year yields currently over 2.4%. This means the market has already given Powell a free run at 2%, and I predict he enters a flat out sprint to get there. Get ready for a series of 50 basis point hikes.
A higher discount rate is priced in
As rates rise, the present value of future cash flows declines. A result of these higher policy rates will be faltering valuations, especially at companies that are highly indebted and heavily reliant on rolling financing. In atmospheres such as the current one, in which tighter monetary policy eliminates the marginal borrower from securing financing, companies will fail. Nevertheless, Fed Funds futures are already priced at above 2% this year, and the stock market hasn’t suffered anything resembling a crash—the S&P 500 is only 5% off its all-time highs! This is yet another green light for Powell to slam on the accelerator on his way to a 2% Fed Funds rate; if the market hasn’t crashed based on an aggressive hiking path this year and is potentially even agreeing with Powell’s premise that fighting inflation will keep corporate profits buzzing, Powell must seize the day.
What happens, however, when more risky assets are not able to sustain the new, higher discount rate? Credit spreads rise, and bondholders begin to take losses. Equities that have survived on inflated valuations suffer declines. All of these losses occur before and during recessions, which is why the flattening of the yield curve is such a massive signal that yields are eventually heading lower.
The bear flattening
Yields are rising across the curve, last week quite dramatically. The uptrend has been intact for about two years now. Calls for the end of the great sovereign debt bubble have gotten louder. But the bearish move has been a bear flattener, a dead giveaway that longer-term Treasuries are being stubbornly hoarded, the opposite of bubble-bursting market participant behavior. Allow me to explain this.
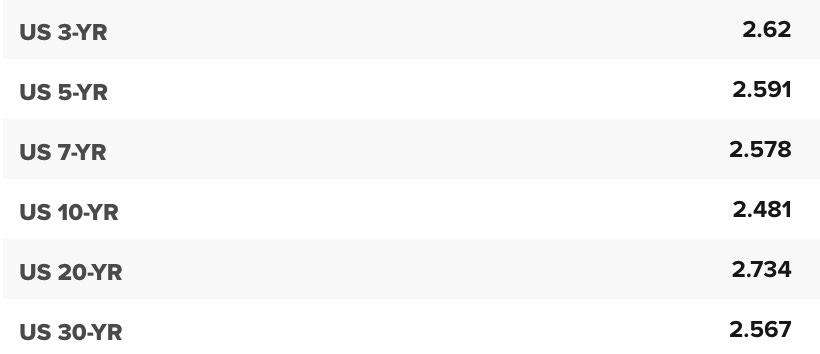
Take a look at the yield curve as of the evening of March 28th. We can see that parts of the curve are inverted, including 3s30s for example. This means that an investor holding a 30-year US Treasury refuses to sell it for a higher-yielding, shorter-maturity 3-year note. But why? The answer is that the 30-year investor does not believe that when his or her 3-year note matures, a rate higher than 2.56% will be available in the market at that time. Essentially, the 30-year holder believes that a 30 year stream of 2.56% coupons is a preferable investment to the higher yield of 2.62% because there is no guarantee a similar yield will be available from year 4 to 30 of the investment horizon. The Bitcoin Layer has been all over this topic—my first post on yield-curve inversions was all the way back in October 2021.
A bearish move in Treasuries we certainly have seen, but one that has come in the form of a massive bear flattening. Only a bear steepening, in which longer-term Treasury yields are rising rapidly, would indicate some sort of bond bubble bursting. While there are tens of trillions of dollars of risky credit instruments that could face serious impairment in the absence of Fed liquidity flooding the system, Treasuries significantly benefit in this environment because they are the only safe way to store US dollars. Imagine keeping $1 trillion on deposit with Deutsche Bank…no thank you.
Layered money
The real bubble in the fixed-income markets is in bank liabilities and other securities, not in US Treasuries. When the pandemic swept the globe, shutdowns halted economies, and it was clear the US government would need to borrow trillions upon trillions to support industry and the public for over a year, Treasury yields plummeted as demand for safety skyrocketed. Treasuries are still the risk-off asset of choice, and there is frankly no debt-to-GDP ratio or declining foreign buyer base on the horizon that could challenge this well-established market dynamic. With global bond and equity markets valued at over $100 trillion each, exposure to the relatively small $30 trillion Treasury market, much of which is tucked away by longer-term investors domestically and internationally, is a requirement for risk managers. Imagine a portfolio manager telling a sovereign client it owned no US Treasuries but instead a portfolio of CLOs and high-yield corporate bonds going into a period of Fed tightening and diminished appetite for risk assets. They don’t exist—all of the world’s largest asset managers expose their clients to US Treasuries.

Top of the channel?
Let’s take a closer look at the price action on 10- and 30-year US Treasury yields. Remember that prices rise as yields fall, so each of these long-term declining trends in yields translate into a long-term trend of increasing prices.

The first chart is of 10-year yields. I’ve drawn a pair of trend lines here. One you can see connects the 2007 high with the 2018 high. The other trend line stretches back to connect some of the highs of the 1990s. Both converge in the 2.50%-2.75% area, hence my call from February. I believe the uptrend is exhausting itself.

This chart of 30-year Treasury yields tells a similar story—I’ve connected several of the lower highs over the past two decades, and the trend line comes in around 3%. For both 10- and 30-year Treasuries, there’s no doubt we are flirting with breaking these longer-term downtrends. But everything I’ve ever learned about how our financial system works tells me that US Treasuries still fulfill the role of risk-free asset in the dollar spectrum, and amongst the proliferation of bank-issued credit, US Treasuries become the only way to safely store dollars and avoid endless counterparty risk. The main reason I believe that yields will come back down is the cycle.
Tighter policy will slow growth and inflation
An inverted yield curve, which we already see, is a sign that long-term growth and inflation expectations have fallen below immediate expectations. It implies a recession on the horizon, although it is impossible to know when. Whether the growth slowdown happens because we are near the end of the business cycle or because the Fed tightens policy into restrictive territory, Fed hikes always precede a recession.
With the Fed about to hike rates to 2% in rapid fashion, we will see an impact from that on the real economy. At the margin, higher interest rates should slow the housing market, inhibit corporate borrowing and potentially the strength of the labor market, and dampen asset valuations. This is absolutely the Fed’s goal, as 8% inflation is leaps and bounds beyond where the Fed would prefer it to be.
What does slowing growth and inflation expectations do to Treasury yields? It sends them lower. The inverted curve already tells us that long-term yields are falling below next year’s potential policy rate. When the Fed eventually is forced to cut rates, the bull steepening of the yield curve will send short-term rates to zero and drag long-term rates somewhat lower with them. Note that this all happens without any assistance from the Fed. Yields will go back down without any QE or yield curve control. In fact, the Fed will be shrinking its portfolio of Treasuries during this time in a process called Quantitative Tightening.
Quantitative Tightening introduces volatility
The Fed’s QT, although a net reduction of demand for US Treasuries by the Fed’s portfolio, ends up being bullish for the risk-free asset. First, QT is an unwind of the Fed’s holdings, usually by way of letting securities mature without investing the proceeds. When these securities mature, reserves are destroyed from the balance of whichever primary dealer the Fed originally purchased the Treasury securities (during QE). The destruction of reserves effectively saddles the private sector with the responsibility of absorbing Treasury issuance going forward, which in turn has a crowding out effect.
When risk-free yields reach a certain level that adequately compensates investors—technically speaking when risk-adjusted yields of Treasuries exceed that of riskier assets—Treasuries get absorbed by the market. This displaces demand for other assets, such as corporate bonds and structured securities, as the capital is simply deployed elsewhere. The displaced demand is in effect the tightening of policy the Fed wants to see—stuffing private hands with Treasuries so that they won’t go invest in other riskier things, leading to reduced investment and slower growth and inflation. Risk assets would suffer in this scenario, leading to a bid for Treasuries once again as the preferred risk-off asset.
Second, QT also means the Fed’s portfolio of mortgage-backed securities (MBS) will mature. This introduces volatility into the financial system, as the Fed purchasing MBS is effectively acting as an artificial volatility suppressant. This is because purchasing MBS is selling optionality to home borrowers, as the borrower always retains the option to repay early and call the loan. Without the Fed, private hands must sell that optionality, but it is likely that private hands demand a higher option-adjusted spread for that type of lending. If investors are once again saddled with MBS, their risk models will tell them to invest less in other risky assets, adding another component of financial tightening to the mix. The more risk that emerges across risk sectors, the stronger the demand for Treasuries will be. Between MBS and US Treasuries, the Fed’s portfolio has about $2.2 trillion maturing over the next three years.
What about bitcoin?
Bitcoin’s current technical setup is very attractive. All the bullish momentum from the past couple years has finally wound down, setting a solid foundation for the next leg higher in bitcoin price. I expect the consolidation zone of about $40,000 to set a healthy base for a move above $100,000 as we enter a new price regime for bitcoin and another repricing. Bitcoin’s gravitational pull towards $9,000 during 2018-2020 and then achieving a 4x to its next consolidation zone brings a price of about $160,000 into play for bitcoin’s next run over the next year or two. Needless to say, I’ve gotten pretty bullish on bitcoin’s fundamentals after surviving the initial purge from tightening monetary policy. Leverage in the bitcoin markets vanished but left a higher low, setting the stage for confident and strong-handed buying in 2022.

At the beginning of March, I started to get very bullish on the bitcoin price, while last week I set the table for a bullish MACD crossover on bitcoin’s weekly chart. This weekend we officially triggered it, and while a lagging indicator of momentum, trading desks around the world are all looking at bitcoin’s chart with a little bit of drool, as price patterns indicate that bears have exhausted themselves and the bulls are gaining full control of this market.
This brings me to a point about bitcoin’s sensitivity to the global macroeconomy and monetary policy. We have seen bitcoin trade in lockstep with risk assets for extended periods of time over the past several months, but this price regime might be petering out. Only time will tell if bitcoin can shake all these rate hikes and break out on pure supply and demand fundamentals. After all, bitcoin does not have any cash flow, therefore its present value has no sensitivity to changes in the discount rate.
This post was sponsored by Voltage, provider of enterprise-grade Bitcoin infrastructure.
