

Weakness
Swiss Cheese

Cheese with holes is usually something to smile about. In markets, it is not. The recent sell-off in bitcoin did not just slice through important levels like $100,000 and $96,000; it exposed how little real support there was underneath. What should have been heavily defended zones turned out to be soft spots, with price cutting through them like they barely existed.
In this letter, we walk through what happened, what has changed, and what might come next. We look at the lack of reaction around key levels, the growing unrealized losses for Short Term Holders, and the signals from on-chain tools like MVRV and the relationship between the STH cost basis and the 200-day moving average. We also revisit the four-year cycle idea and question whether it still applies in a market where participants, macro conditions, and liquidity dynamics look very different from previous cycles.
Some of the data still fits a “bull market correction” narrative. Some of it points to a possible regime change and a prolonged downtrend. At the same time, the macro backdrop and gold’s recent performance do not fully line up with a classic, brutal bear market either. This mix is what makes the current environment so uncomfortable. It feels different, and the usual templates do not perfectly apply.
What follows is not a neat story with a clear prediction. It is an honest attempt to line up the evidence, separate emotions from signals, and rethink the path forward.

Secure your bitcoin’s future—and your family’s peace of mind. Too many heirs lose access to bitcoin because there’s no clear inheritance plan. We’ll show you how to change that.
On Wednesday, Nov 19 at 11:00 AM CT, join Dhruv Bansal (CSO, Unchained), Jeff Vandrew (CFO & CLO, Unchained), and Joshua Preston (CEO, Gannett Trust) for a live fireside chat on how to make your bitcoin legacy secure, simple, and built to last. We’ll cover:
Transfer on death beneficiaries: A new Unchained feature for designating who inherits your bitcoin and removes uncertainty for your family.
Connections: Our vaults are uniquely built to let you share custody to help your heirs or trusted partners securely recover your bitcoin when it matters most.
Estate planning: How Gannett Wealth Advisors’ expert financial guidance integrates with Unchained to protect your keys and your legacy.
Bring your questions—this conversation is designed to give you clarity on how to make inheritance seamless with real bitcoin, not IOUs.
WHEN: Wednesday, Nov 19 at 11:00 AM CT — online, free to attend.

Blockstream Jade Plus is the easiest, most secure way to protect your Bitcoin—perfect for beginners and pros alike. With a sleek design, simple setup, and step-by-step instructions, you’ll be securing your Bitcoin in minutes.
Seamlessly pair with the Blockstream app on mobile or desktop for smooth onboarding. As your stack grows, Jade Plus grows with you—unlock features like the air-gapped JadeLink Storage Device or QR Mode for cable-free transactions using the built-in camera.
Want more security? Jade Plus supports multisig wallets with apps like Blockstream, Electrum, Sparrow, and Specter.
Protect your Bitcoin, sleep better, stack harder. Use code: TBL for 10% off.
Cheese with holes
When analysing an asset and the broader market, you’re trying to assess where it’s probable that buyers step in and sellers leave the scene. The fact is, nobody knows for sure. It’s about human behaviour, and it’s a guessing game about what those humans are thinking.
But you can make it an educated guess backed by data. So when bitcoin is in a high timeframe uptrend, a pullback could offer an opportunity to get exposure or to increase exposure. The cost basis of certain investors (ETF investors, Short Term Holders, Long Term Holders) is usually a great data source to get an idea of where buyers might step in. Other sources, like volume profiles, which show where most volume and thus most investors entered a position, can shine a light on which area might get defended. Then you have psychological levels, like the $100,000 mark.
We have been covering such levels extensively on an ongoing basis. But we don’t know for sure how people will respond to these levels until they hit. As you know, they got hit. And it wasn’t great. Price went through these levels like a hot knife through butter. In Dutch, we call a sports team with a weak defence “gatenkaas,” which means “cheese with holes.” The offensive team just walks through the defence like it isn’t there. That’s the feeling we get when we look at the most recent price action. Selling pressure overwhelmed a complete lack of buying pressure.
These sell-offs sometimes happen during illiquid times, like weekends. What you see is that the willingness to buy is there, but buyers can’t act at that moment in time. What often happens next is that they step in when the markets open again or when banks transfer their money to the trading accounts. Buyers step in, price recovers in a V-shape. We saw weakness throughout the weekend, which could hint at illiquid markets. But if that was the reason for the weakness, we should have seen a quick recovery to above $100,000.
The reality was the opposite. Prices fell even further. It seems that instead of buyers being prepared to buy after the weekend, sellers were prepared to dump more after the weekend. Also notice the hammers above the 3-day RSI. Every time RSI tried to get above its MA, it got rejected.
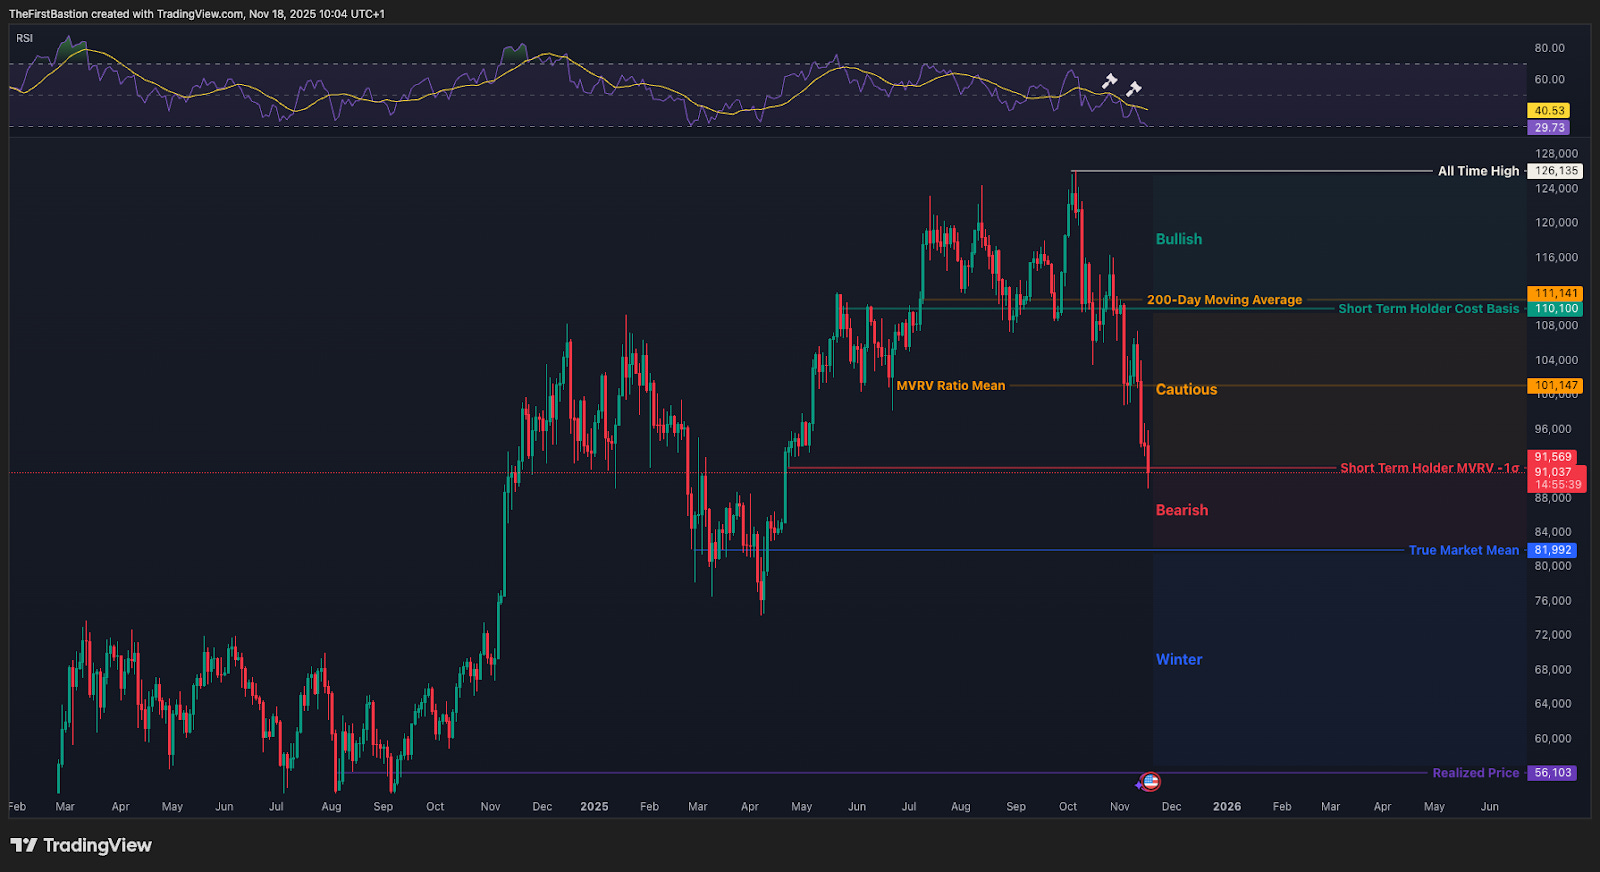
The entire “Cautious Zone” should have offered way more resistance if most investors really thought that price would go much higher from here. If most investors had that mindset, they would step in and buy bitcoin to ride another leg higher. It’s voting with your money.
If we see this kind of price action, it looks like the opposite. It feels like the majority of investors think the market goes lower and are actively selling or joining forces and throwing some additional fuel onto the fire.
We have been comparing this pullback with the others from August ‘24 and April ‘25. But back then, it was more obvious why the selling took place. It was about the Yen Carry trade winding down and the Tariff Tantrum. This time, it’s a lot of selling without one specific reason.
This chart shows that the price just fell through the most heavily traded volume of the entire 12-month range. The True Market Mean is currently within “rock-throw” distance, and even the “2021 High” is coming into sight again.