


More Cycle! Explaining TBL's Wayfinder
More Cycle! Explaining TBL's Wayfinder
Breaking down further the three components to our economic indicator framework.


Dear readers,
Last week we presented to you our Economic Cycle Wayfinder. Despite a name that you might have found strange, you let us know that you found it interesting. Today, we will dissect our Wayfinder a bit more to explain its value, as well as more of an explanation of why the economic cycle matters so much. On Friday, we’ll have a big post about the rampant liquidations and bankruptcies going on in the world of crypto and the implications for bitcoin.

Voltage helps you solve the biggest problem with Lightning nodes and scaling. No more headaches with maintenance, reliability, or uptime issues. Voltage makes running Lightning instant and now easier than ever. These radical improvements to Lightning empower startups and enterprise brands to bring incredible applications and services to market. You can also spin up a personal node and pay by the hour. Scale your infrastructure as fast as Lightning itself. Create a node in less than 2 minutes, just visit voltage.cloud.
Absolute level versus rate of change
We’ve introduced some more data to our charts and altered our overall Wayfinder formula, but before we discuss the average, let’s take one more look at each indicator and explain the visual additions.
In this time series of ISM Manufacturing PMI, we have drawn our expansion/contraction midline at 47. While the survey itself uses 50 as its midline (responses in the affirmative will generate readings above 50, while responses in the negative will generate readings below 50), we chose to adjust the midline down, for our own purposes, by looking at the time series and comparing it to GDP:
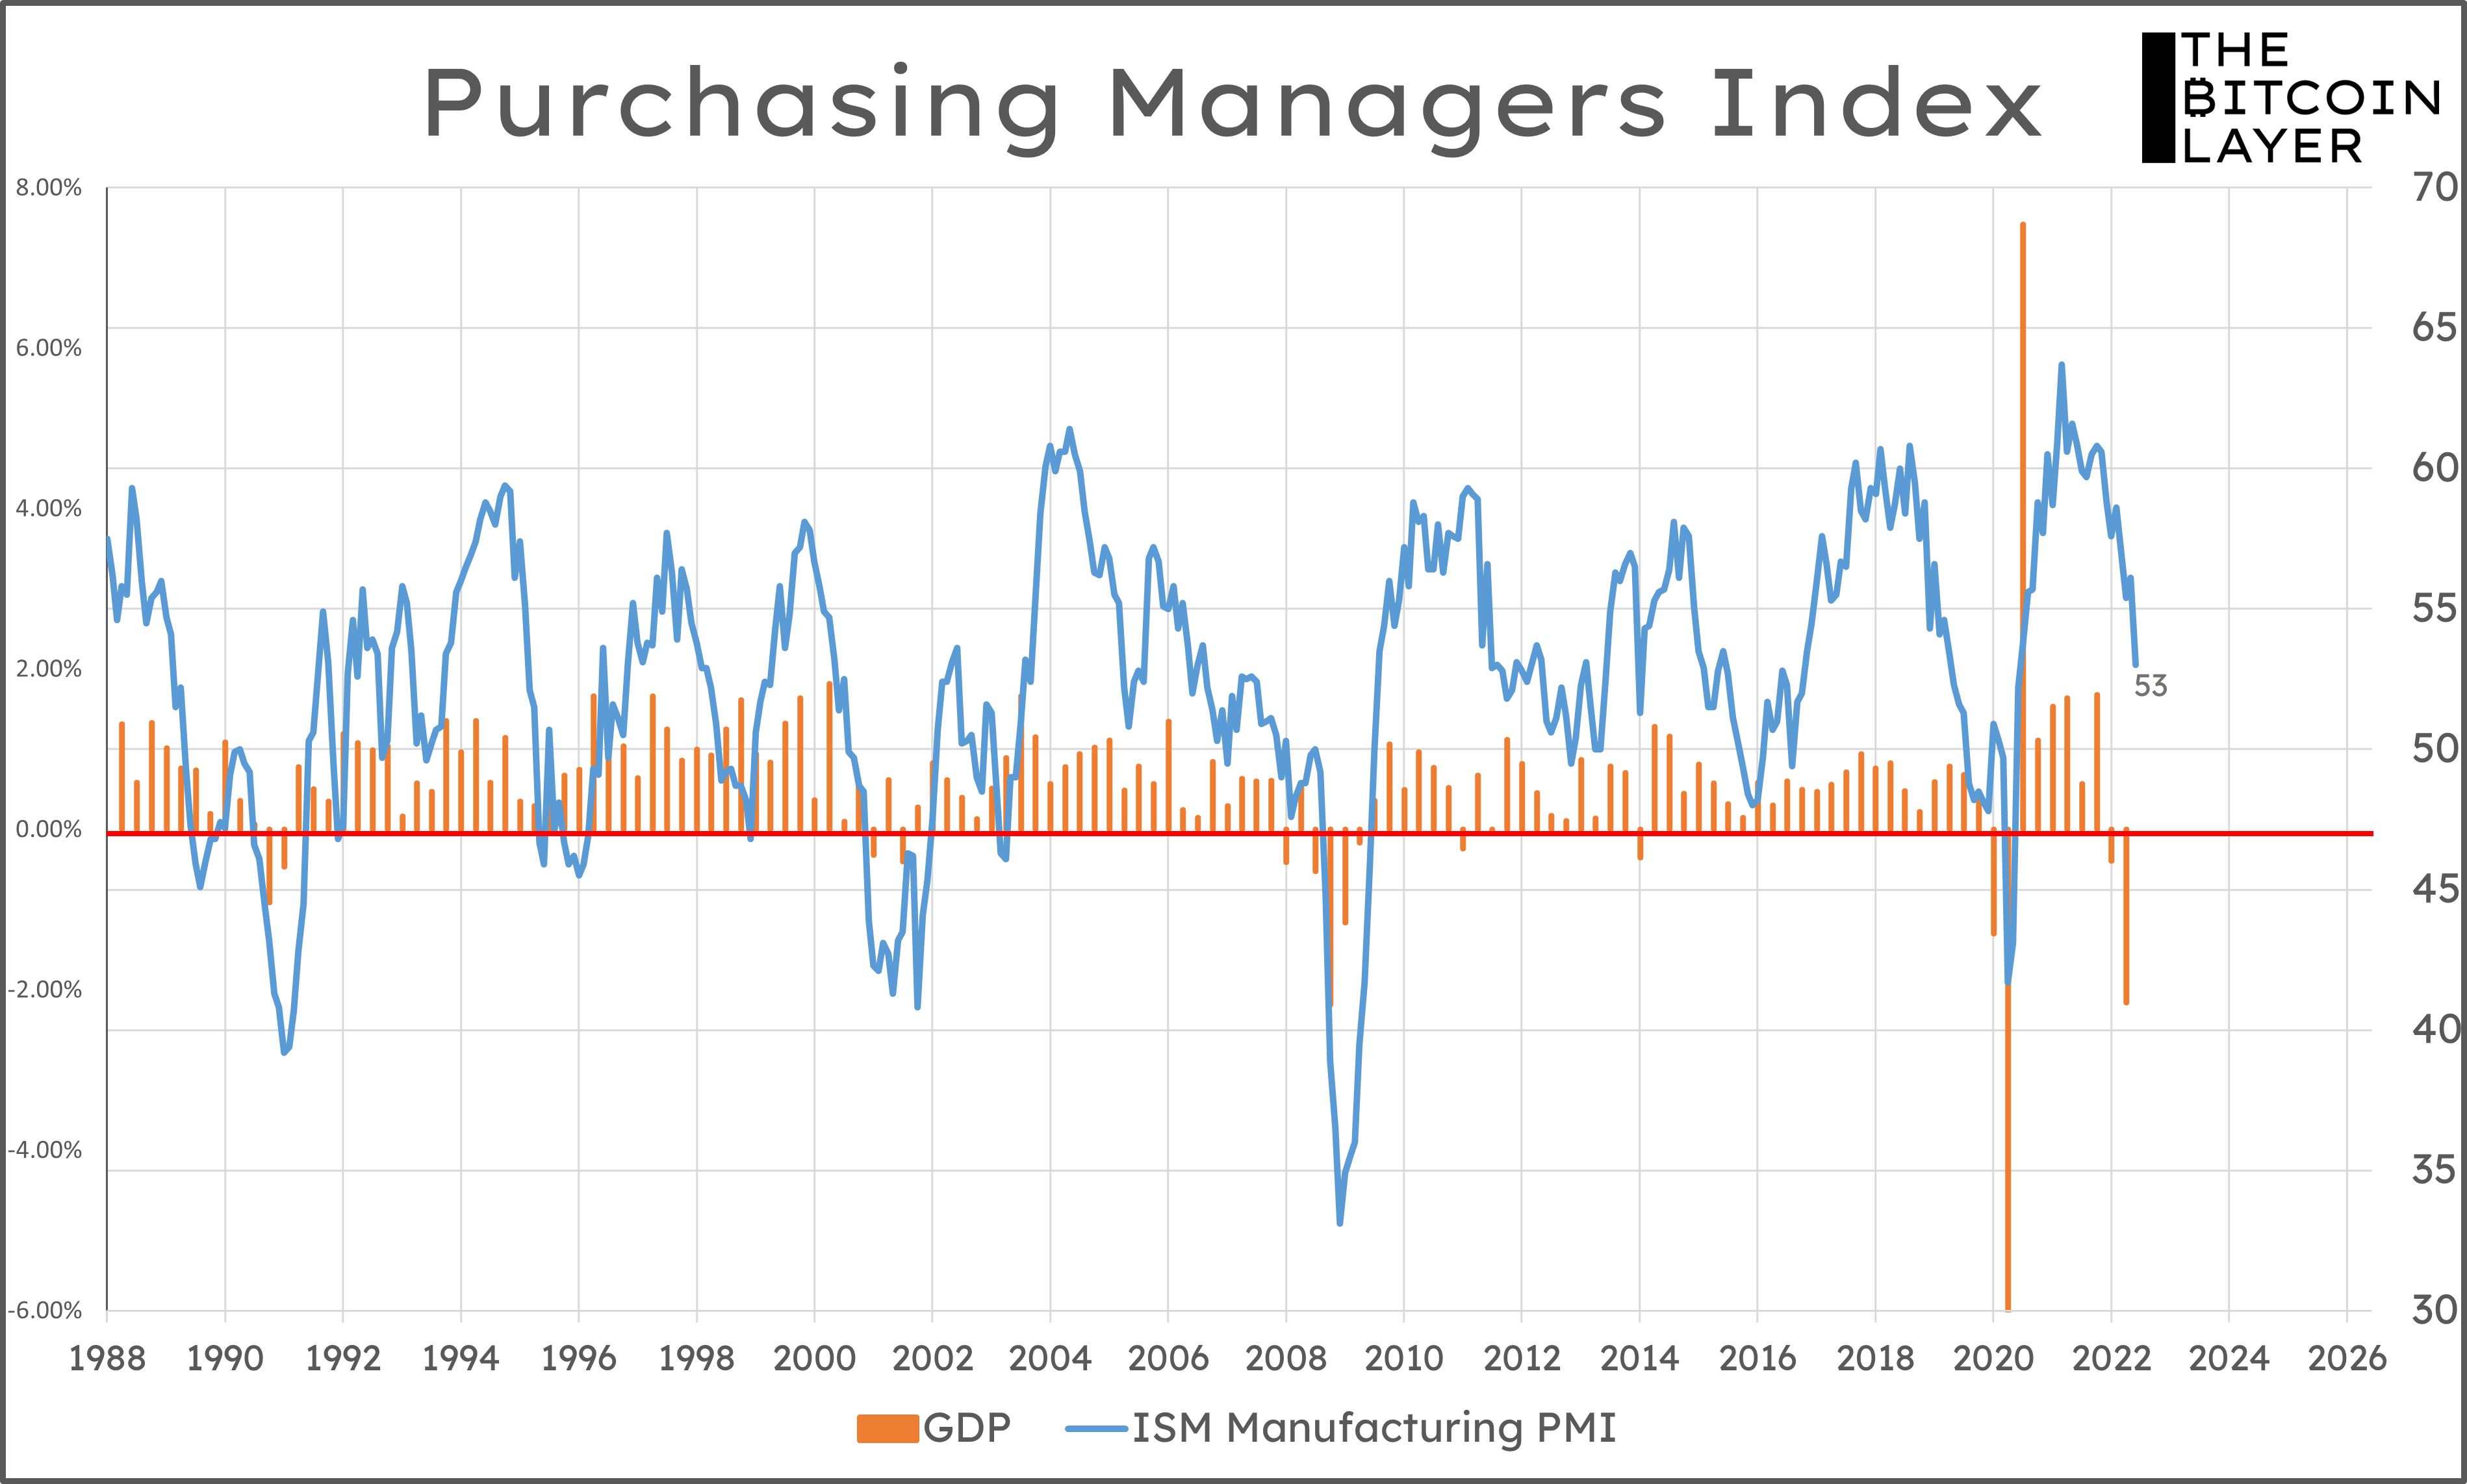
The alignment isn’t perfect, but if you look at 2008 and 2020, for example, you will see that once ISM dips below 47, negative GDP growth (the orange bars) does tend to appear. Additionally, we can see many examples of ISM going below 50 without any hint of contraction—however, we still must observe that directionally the two are in-sync, whether or not we are trying to nitpick this expansion/contraction line. Examples of this are in 2003 (ISM even dipped below 47 briefly) and 2015—during neither of these periods did GDP decline.
This brings us to perhaps the most important point of our cycle-approach from an economic indicator perspective.