Retail Sales Cool, But Pockets of Strength Remain
Dear readers,
For quite some time now, we have been arguing that the US consumer is strong, but wary. This is because the labor market, in our view, shows continued signs of resilience with some notable slowdowns that typically happen during summer months (as explained in our most recent TBL Weekly).
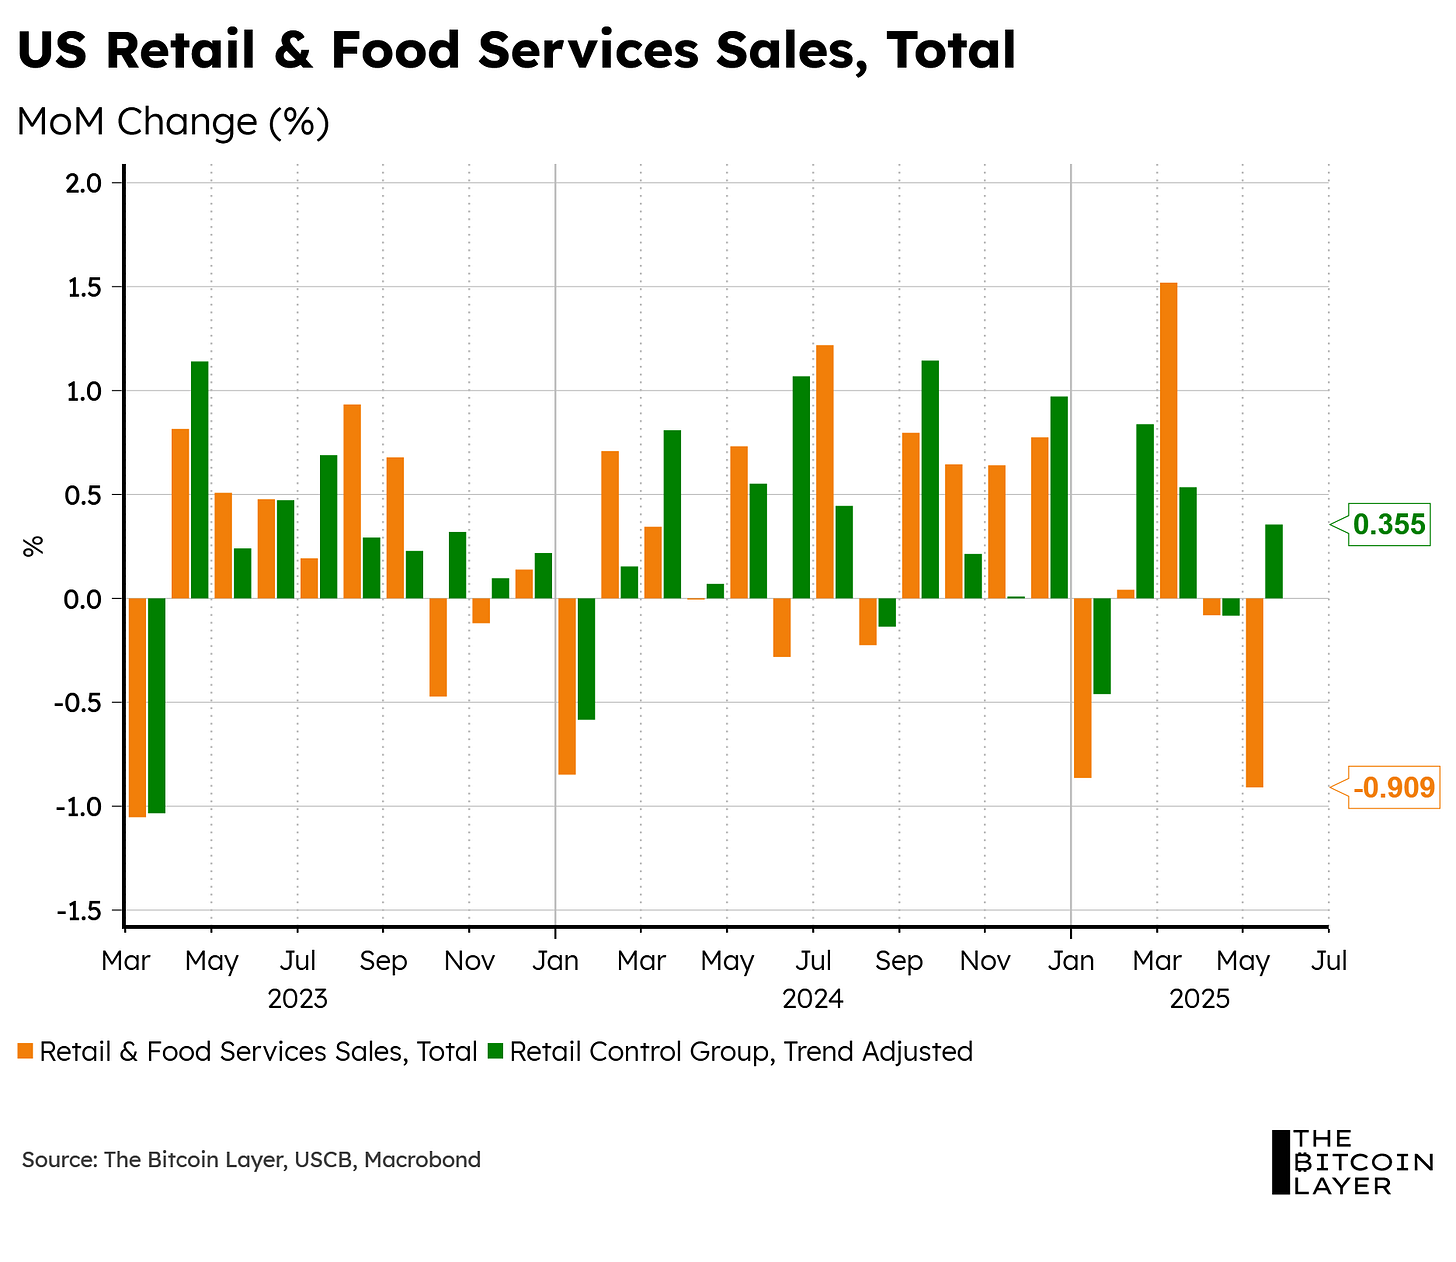
Today, we got some more information on where the US consumer stands, and the headline number wasn’t pretty:
Analysts expected a -0.6% slowdown in the total print, but we instead got a -0.909% decrease (a pretty big miss). However, as you can also see from the chart, the control group (which is arguably more important than the headline number since it excludes receipts from auto dealers, building-materials retailers, gas stations, office supply stores, mobile homes, and tobacco stores) saw growth this past month.
To gauge the US consumer better using today’s print, here are some charts showing some individual and important components of retail sales.
Is bitcoin’s next parabolic move starting? Global liquidity and business cycle indicators suggest it may be. Read the latest report from Unchained and TechDev, analyzing how global M2 liquidity and the copper/gold ratio—two historically reliable macro indicators—are aligning once again to signal that a new bitcoin bull market may soon begin.
The Financial Freedom Report is a weekly newsletter from the Human Rights Foundation (HRF) that tracks how authoritarian regimes weaponize money to control their populations and suppress dissent. It also spotlights how freedom technologies like Bitcoin are helping everyday people reclaim their financial independence and freedom.
A one-of-a-kind newsletter connecting the dots between financial repression, geopolitics, and emerging tech.
Smart macro analysts don’t just watch the Fed. They watch the world.
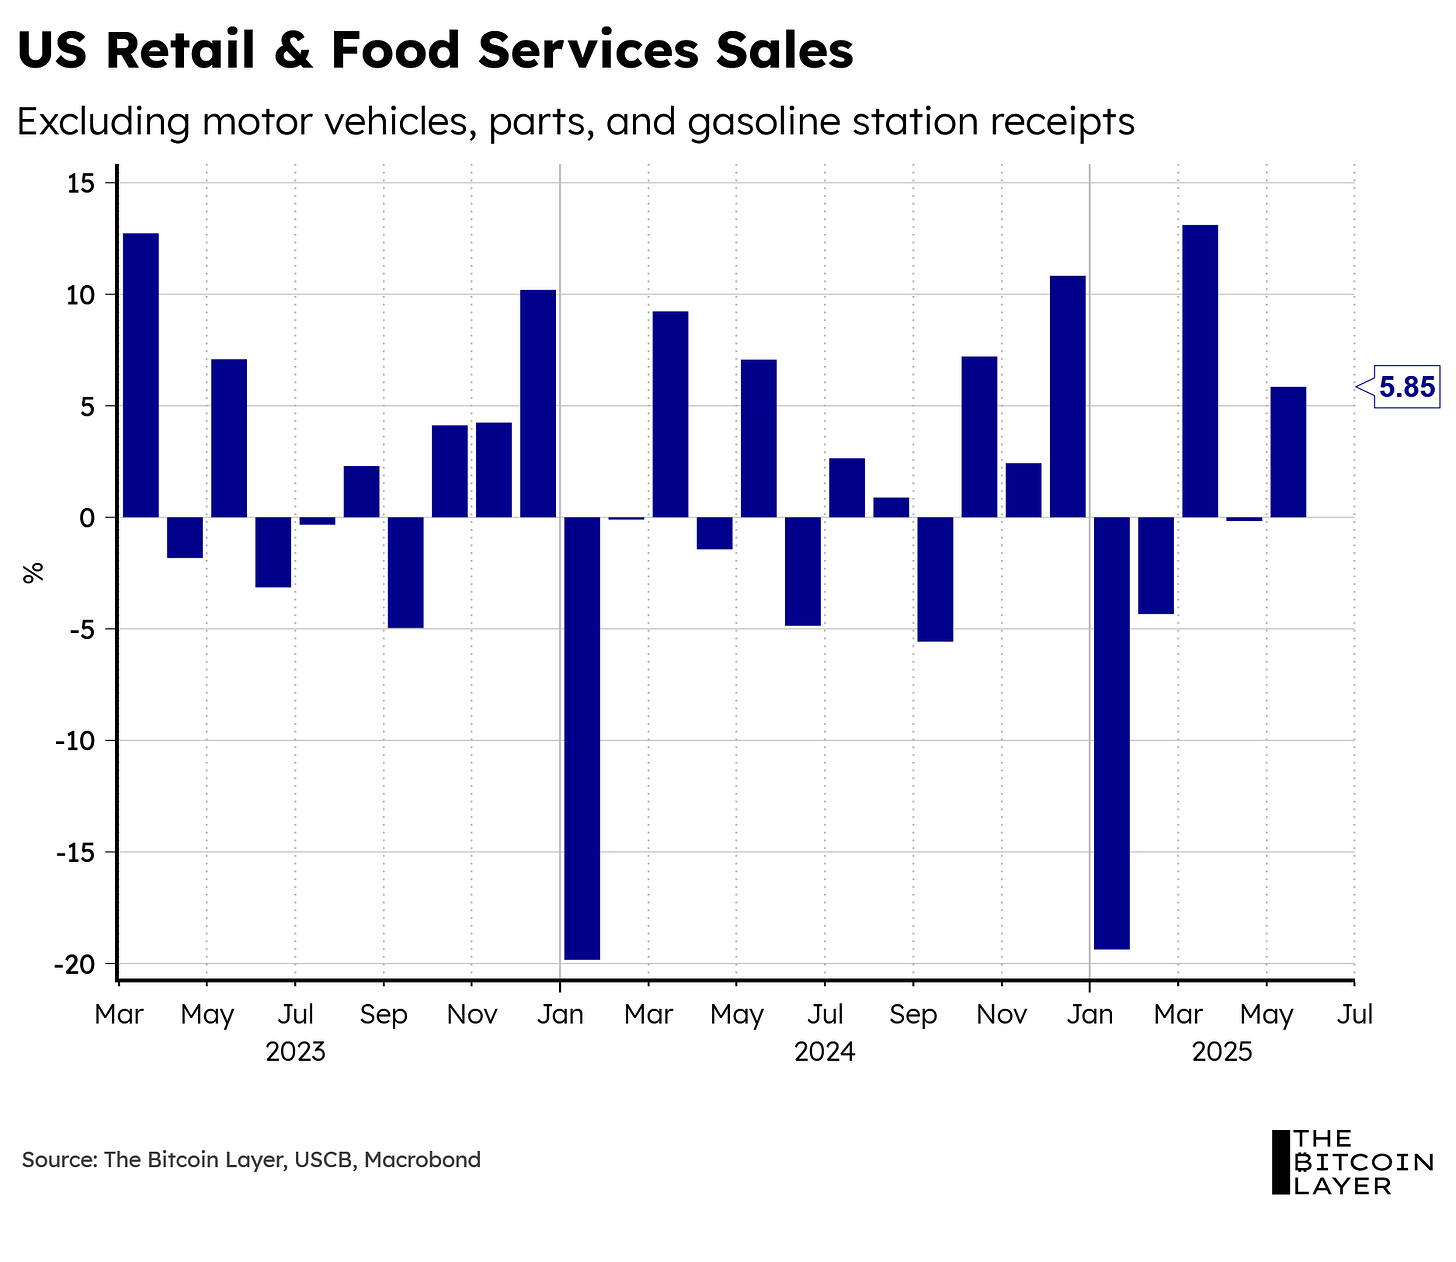
Let’s first start by excluding auto, parts, and gasoline receipts from the total print:
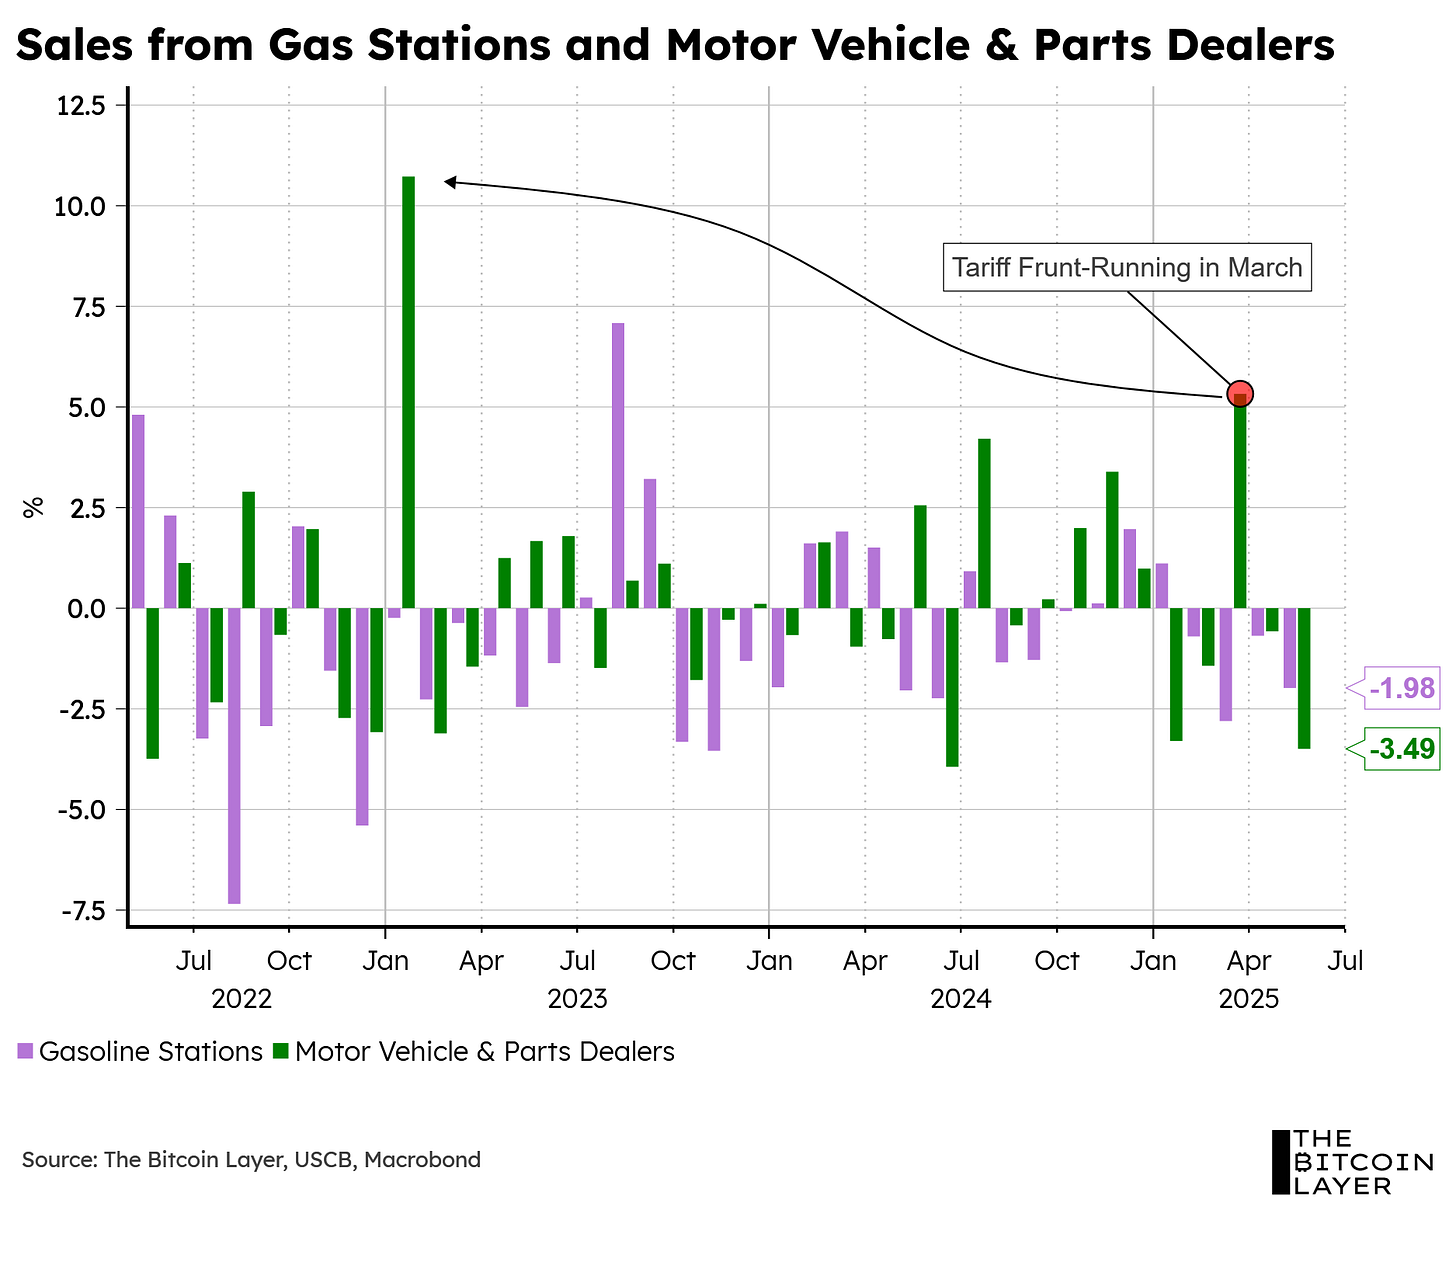
Much like with the control group, we see solid growth in retail sales when removing the auto industry. This tells us that the main drag in the headline report is autos, which makes sense given all the tariff front-running that took place at the start of the year, which increased sales to their highest levels since early 2023 (see chart below):
The chart above also showcases repeated declines in gas station sales throughout 2025, which could partly explain the lower oil prices we’ve seen this year—that is, pre-Israel-Iran conflicts. Below, we overlay Brent crude oil over US gasoline store sales:


