


The Good Ol' Basics: TBL Weekly #148


Dear Readers,

As the long 4th of July weekend approaches, we decided to keep this week nice and simple before you all head out to your preferred vacation spots to set off some fireworks. Nothing is nicer or simpler than some good ol’ chart commentary. In today’s Weekly, we will look at our specialty:
TBL Liquidity charts (which include equity market charts and US dollar charts);
And US rates charts; and,
Bitcoin charts.
So, without further ado, let’s dive into TBL Weekly #148.

Stop treating bitcoin like any other asset. It’s time to build a long-term strategy and declare your financial independence. Unchained’s Financial Freedom Bundle is designed to help serious bitcoin holders secure their future by taking control of their generational wealth.
Request the bundle to get:
A premium bitcoin coffee table book, Foundations
A digital copy of our 2025 hardware wallet guide
An invite to an exclusive July macro strategy session with Tuur Demeester
First 100 to request a bundle receive a physical copy of Foundations.

The Financial Freedom Report is a weekly newsletter from the Human Rights Foundation (HRF) that tracks how authoritarian regimes weaponize money to control their populations and suppress dissent. It also spotlights how freedom technologies like Bitcoin are helping everyday people reclaim their financial independence and freedom.
A one-of-a-kind newsletter connecting the dots between financial repression, geopolitics, and emerging tech.
Smart macro analysts don’t just watch the Fed. They watch the world.
Our videos are on major podcast platforms—take us with you on the go!
Apple Podcasts Spotify Fountain
Keep up with The Bitcoin Layer by following our social media!
YouTube X LinkedIn Instagram TikTok
TBL Liquidity commentary
For this TBL Liquidity section, we would like to bring back a chart that we presented in a TBL Weekly from May 23rd, 2025:
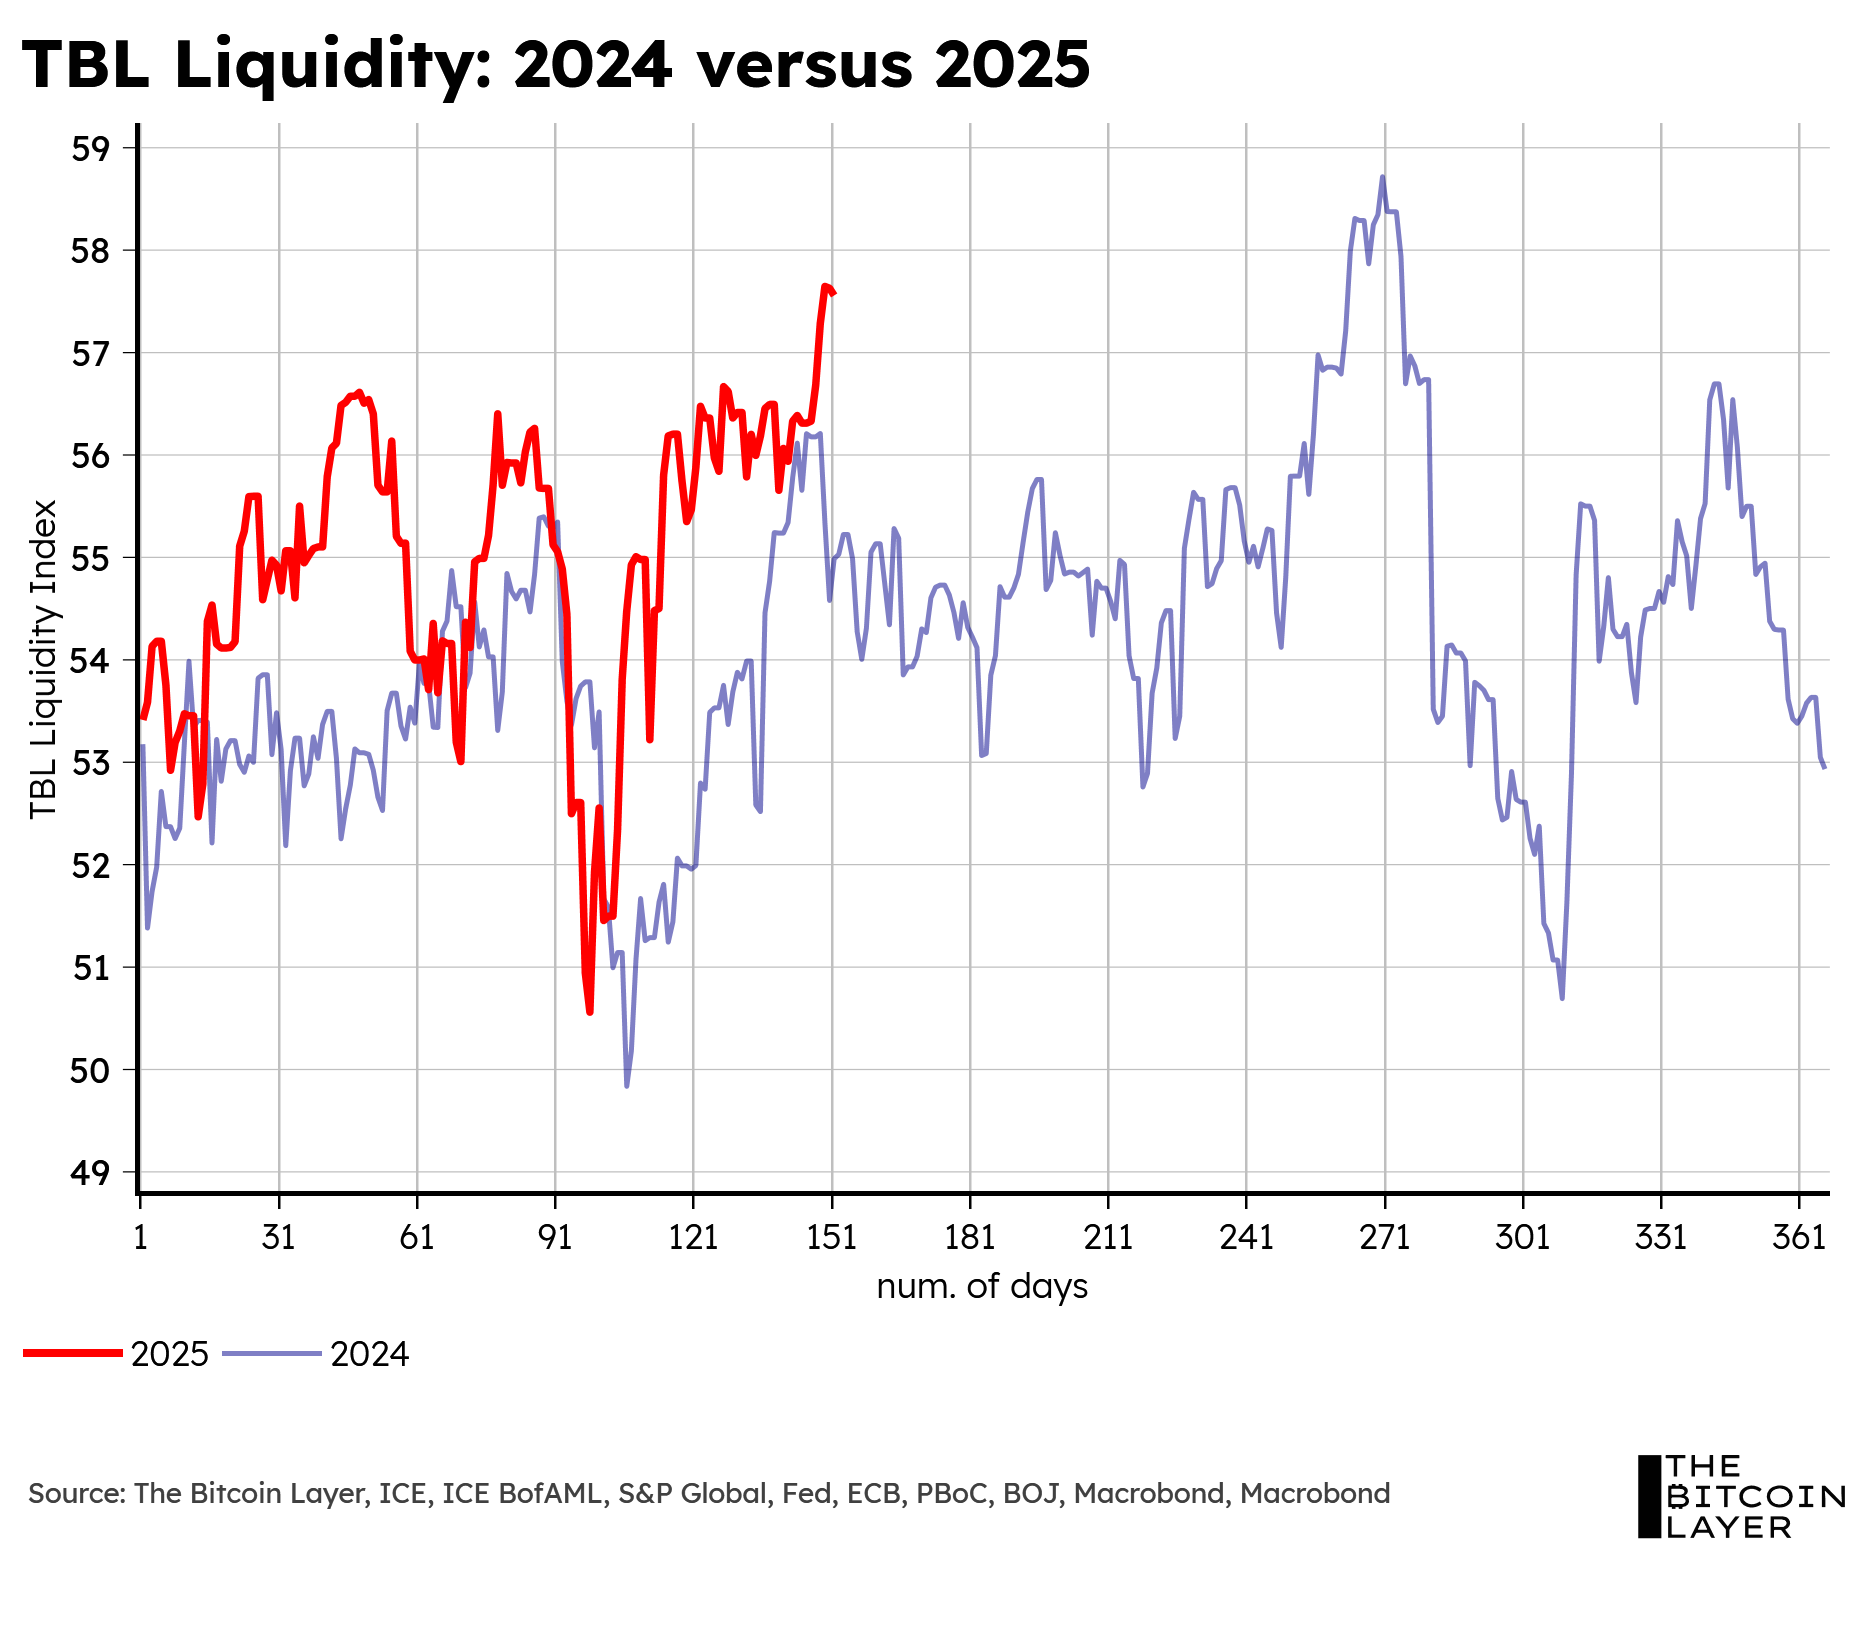
The chart compares TBL Liquidity levels in 2024 to the ones we see today. Here’s what we wrote alongside this chart:
“Today, liquidity levels are matching those that took place during May of 2024. If we extrapolate last year’s trend to this year, using these similar liquidity levels as our foundation for this extrapolation, we expect the S&P 500 to rise at the same pace as it did last year for the next couple of months.”
Here’s the chart that we used as a follow-up to this quote:
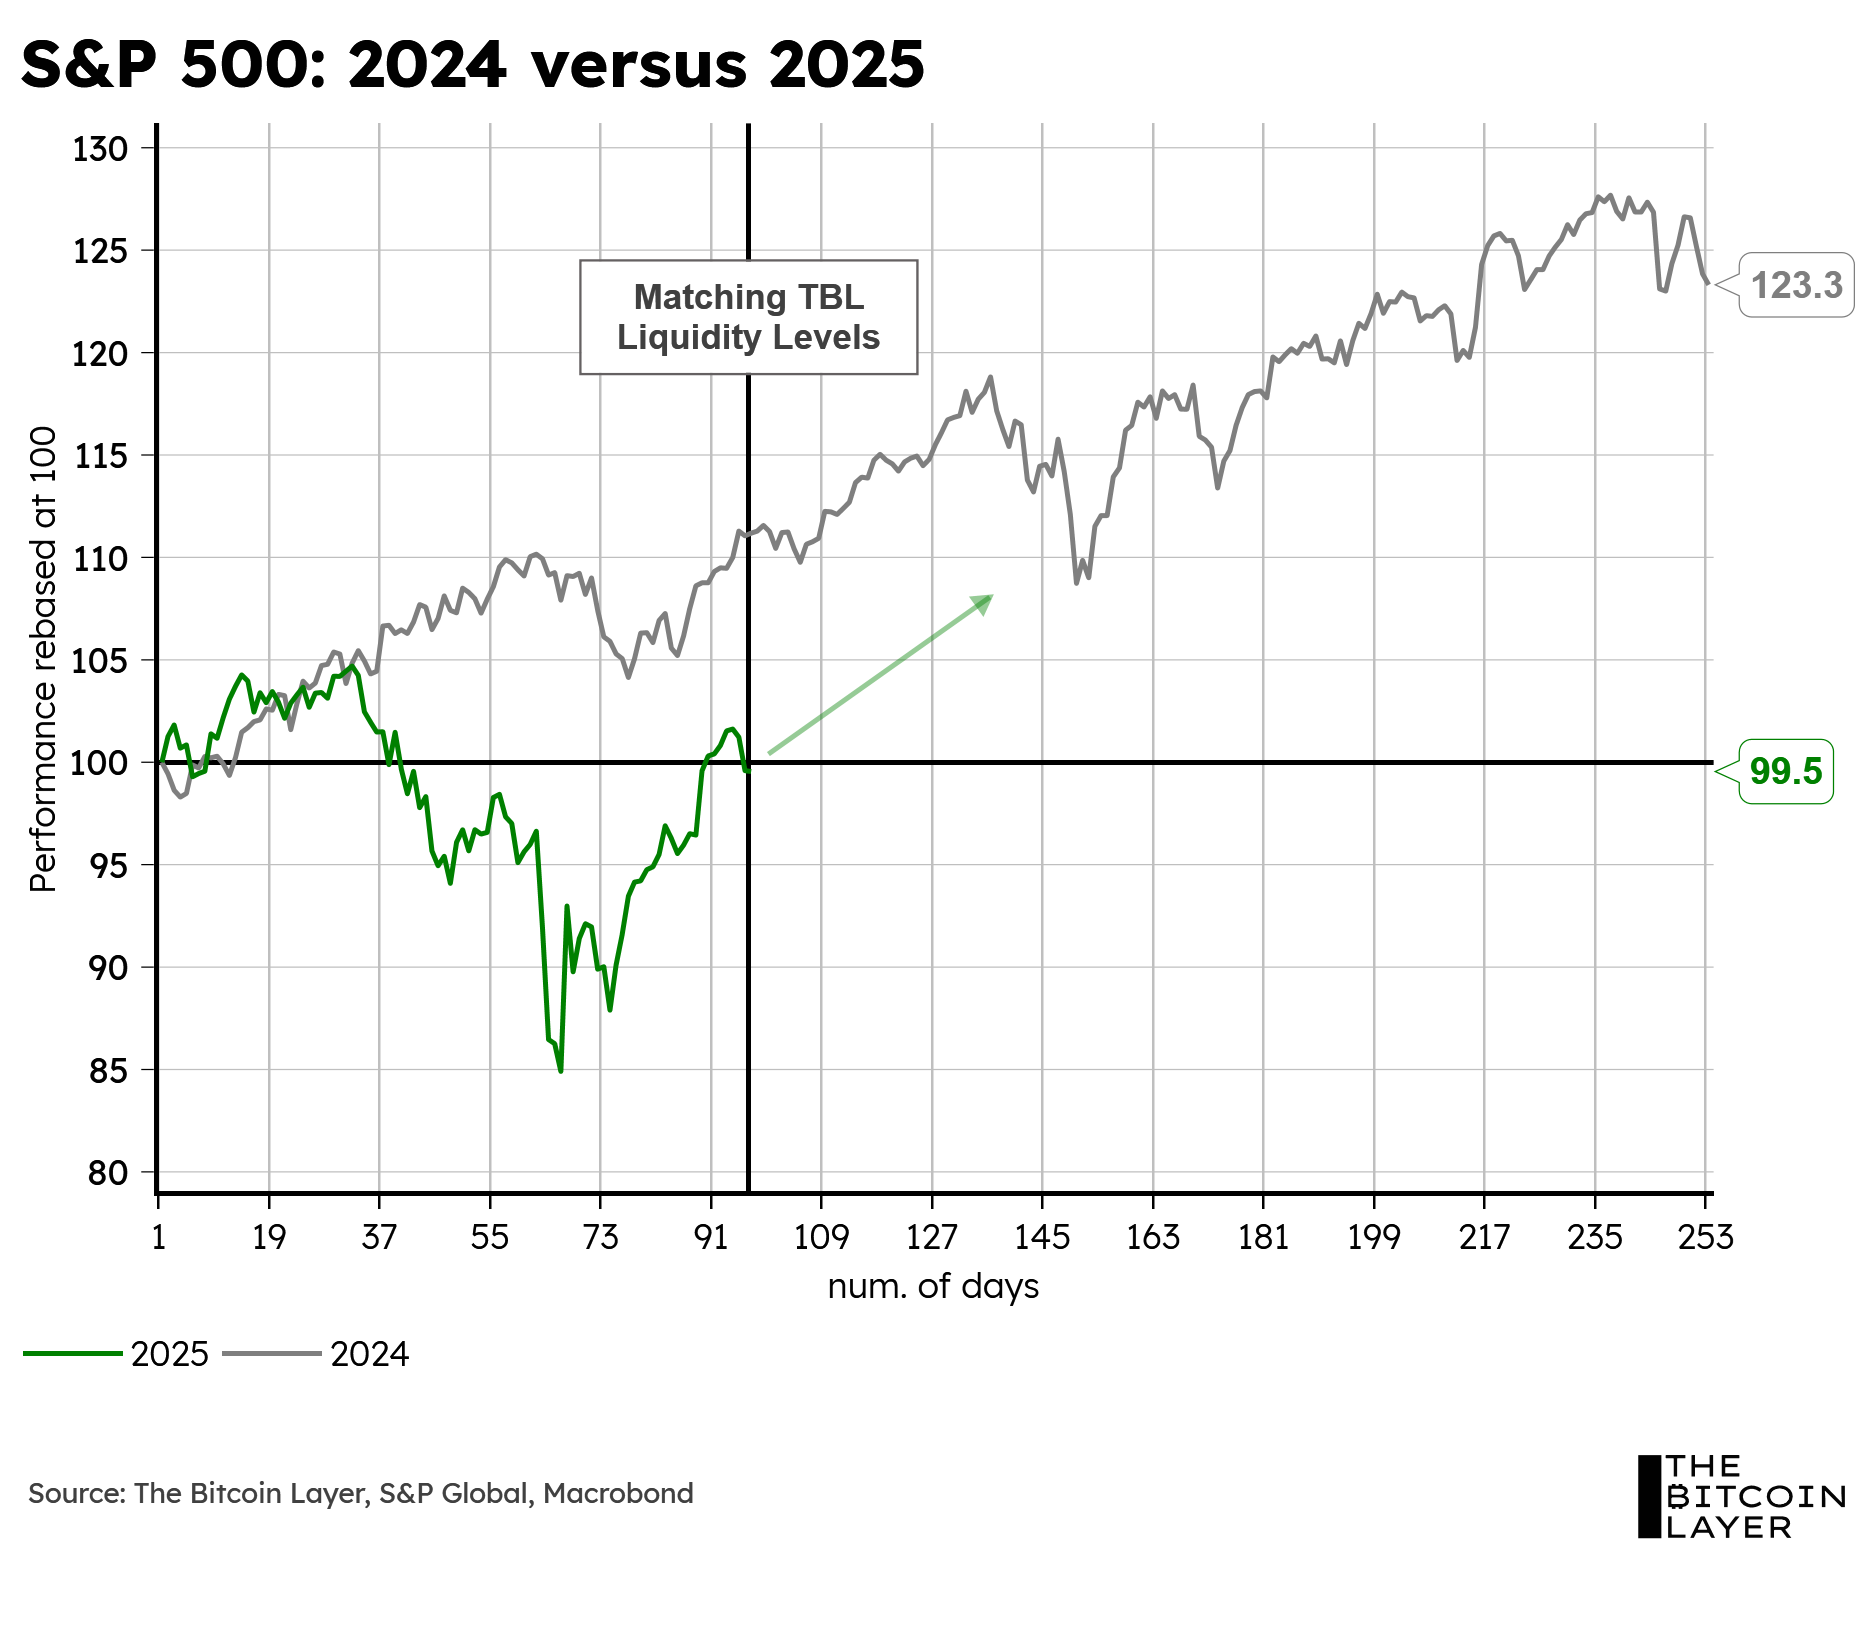
Let us now look at that same chart, except one month later:

The parallel move that we expected to take place…took place. Herein lies yet another way in which we can use our TBL Liquidity index for risk asset expectations. Though not always true, similar TBL Liquidity levels can provide some base-case scenarios for what risk assets might do in the near future.
As it stands today, TBL Liquidity lies at its most expansionary level of the past 10 months, 8 pts away from the contractionary line of 50.

And we believe this is driven mainly by a weakening US dollar this year:

However, we believe we are approaching a period of liquidity slowdown for two reasons: (1) US dollar bullishness and (2) our newfound TBL Liquidity Cycle.
In our most recent Mean Median Mode report, we wrote the following:
“...it is important to note our 68% confidence interval, where we add 1 standard deviation to either side of our 84-day estimate [time between two troughs or two peaks], which leaves us 68% confident that the next trough will be seen, at the latest, near the 107-day mark. In other words, despite our indicator still showing a sell signal, we remain well within reasonable levels of typical cycles. However, we may need to re-adjust our next trough to the latter half of July, given weakness in the US dollar, as well as strength in the bond market.”
Our TBL Liquidity Cycle has yet again entered the neutral zone (chart below), which is right in line with our expectations for when our next TBL Liquidity Cycle trough would take place, given our adjustment to late July. However, this time, conditions look different: